Abstract
The adipocytokine Visfatin (VF) has been linked with visceral adiposity, insulin resistance and Metabolic Syndrome (MS), however, studies have been inconsistent regarding its relationship with these metabolic enteties. The aim of this study was to explore the relationships between plasma VF, High Molecular Weight (HMW) Adiponectin and the MS.
We measured fasting plasma VF and HMW Adiponectin in 29 males with the MS and 29 age-matched male controls. Plasma VF was significantly reduced in MS subjetcs compared to controls (98.2 ± 29.7 Vs.141.4 ± 39.1 ng/ml, respectively, P=0.04). One Way ANOVA showed that subjects with MS and pre-diabetes had extremely lower concentrations of plasma VF (60.8 ± 35.9 Vs141.4 ± 39.1 ng/ml ), for MS and controls, respectively, P < 0.009. HMW Adiponectin concentrations were similar in both groups and negatively correlated with HOMA-IR(r = -0.40, P= 0.03). Using Stepwise regression, WC was independently associated with plasma VF concentrations. There was no correlation between plasma VF and insulin sensitivty or beta cell function measured with HOMA-IR and HOMA % B, respectively.
In conclusion: Reduced plasma VF concentrations may play a role in the pathophysiology of pre-diabetes and cardiometabolic risk, however, this will require further study.
Keywords
Metabolic Syndrome, Visfatin, HMW adiponectin
Introduction
Visceral adipose tissue produces a number of adipocytokines such as adiponectin, tumour necrosis factor-alpha, and interlukin (IL)-6, which modulate insulin sensitivity and appear to play an important role in the pathogenesis of insulin resistance, diabetes, inflammation and atherosclerosis [1–3]. Visfatin (VF) is a recently discovered adipocytokine that was first described by Fukuhara and colleagues in 2005 as being exclusively secreted by visceral fat and had insulin-mimetic properties [4]. VF corresponds to a 52 kilodalton cytokine known as Pre-B- Cell Colony-Enhancing Factor or (PBEF) responsible for maturation of B cell precursors [5]. VF/PBEF has also been shown to be an enzyme that catalyses the rate-limiting step in the Nicotinamide Adenine Dinucleotide (NAD) biosynthetic pathway and is known as nicotinamide phosphoribosyltransferase or ‘Nampt’ [6]. Nampt exists in two forms: intracellularly as ‘iNampt’ and extracellularly as ‘eNampt’; the latter corresponds to VF/PBEF [7]. Administration of exogenous VF to animal models of acute myocardial infarction was shown to be cardioprotective [8]. Moreover, Revollo and colleagues showed that Nampt is essential for normal beta cell function when they demonstrated that Nampt (+/-) heterozygous mice had defects in both NAD biosynthesis and Glucose-Stimulated Insulin Secretion (GSIS) [9]. Interestingly, Nampt(+/-) heterozygous mice developed impaired glucose tolerance and the administration of NMN(the product of Nampt reaction) corrected the defects in GSIS and restored normal glucose tolerance [9]. However, in human beings, the relationship between VF/PBEF/eNampt and the metabolic syndrome (MS), insulin resistance, obesity, and cardiovasular disease has been controversal, as evidenced by the conflicting results from published work [10–12] . It is well established that higher concentartions of plasma adiponectin have been shown to be cardioprotective while reduced concentrations of plasma adiponectin have been linked to cardiovascualr disease insulin resistance, obesity and the MS [13–15]. We hypothesed that subjects with the MS, who are at increased risk of developing type 2 diabetes and cardiovascular disease, would have reduced concentrations of circulating plasma VF. We also measured HMW Adiponectin, the active form among adiponectin multimers.
Research Design, Subjects and Methods
This was a cross-sectional study. Construction workers were screened for diabetes, pre-diabetes and cardiometabolic risk factors as part of a pilot health screening programme conducted by the Construction Workers’ Health Trust (CWHT). Data including demographics, anthropometric measurments, FindRisk diabetes questionnaire, and laboratory results were prospectively entered into a central database. The study population was predominantly male (99 %). A random sample of exclusively male subjects was taken from the central database for the purpose of this study . The full details of the study can be found in the Construction Workers Health Trust screening study [16]. The study protocol was approved by the Joint Research Ethics Committee of the Federated Dublin Voluntary Hospitals and St James’ Hospital. All participants signed written informed consent.
Measurement of Biomarkers
Body weight and height were measured in participants wearing light clothing without shoes. BMI was calculated as weight in kilograms divided by height in meters square. Waist circumference was measured at the level of the umbilicus. Hip circumference was measured at the level of the anterior superior iliac spine. Blood pressure was measured in the sitting position after a 10-min rest period in the left arm. Blood samples were taken in the morning after a 12-hour overnight fast. All measurements and samples were obtained at the healthcare centres provided at construction work sites.
Laboratory Analysis
Fasting bloods were obtained after 12 hours fast and included the following: plasma glucose, lipid profile, insulin, plasma visfatin, and plasma HMW adiponectin. Plasma glucose was measured using a glucose oxidase method [bio Merieux kit/ Hitachi Modular]. Plasma total cholesterol and triglycerides were measured using enzymatic methods (Human Liquicolor kits/ Hitachi Modular). Plasma high-density lipoprotein [HDL] cholesterol and Low-Density Lipoprotein (LDL) cholesterol were measured directly with enzymatic methods (Randox direct Kits/ Hitachi Modular).
Visfatin and HMW Adiponectin Assays
VF was measured in fasting EDTA plasma samples by a specific Enzyme-Linked Immunosorbent Assay (ELISA) [linear range, 0.1–1000 ng/mL; specificity, 100% human) [17], obtained from Phoenix Pharmaceuticals Inc. (Karlsruhe, Germany). The intra-assay coefficient of variation was 5.6% and 5.8% for low and high VF concentrations, respectively. Data were expressed as absolute concentrations.
HMW Adiponectin was determined from fasting EDTA plasma sample by ELISA detection [Millipore]. For measurement of high molecular weight adiponectin plasma samples were extracted with protease treatment following manufacturer’s instructions. Sensitivity of the assay is 0.5ng/ml and the coefficients of intra-assay variations were 0.97–3.41%.
Insulin Sensitivity and Beta Cell Function
Insulin sensitivity was estimated using the homeostasis model assessment for insulin resistance index (HOMA-IR); beta cell function was assessed by HOMA-B. Both HOMA-IR and HOMA-B was quantified using a HOMA calculator as previously described [18].
Glucose Metabolism
All subjects had fasting plasma glucose as screening test and those who had impaired fasting glucose (IFG) of ≥ 5.6 mmol/l underwent a 2- hour oral glucose tolerance test (OGTT) . Subjects were further sub-classified as having impaired glucose tolerance (IGT) if the 2-hours postprandial glucose value was between 7.8 – 11.0 mmol/l or diabetes if the fasting plasma glucose value was ≥ 7.0 mmol/l and/or 2-hours postprandial glucose value ≥ 11.1 mmol/l.
Definition of the Metabolic Syndrome
The Metabolic Syndrome (MS) was defined according to the International Diabetes Federation (IDF) criteria [19] Subjects with the MS were further divided according to the results of oral glucose tolerence and fasting plasma glucose results: subjects with MS and Normal Glucose Tolerance (NGT) were referred to as (NGT-MS); subjects with MS and (IFG) as IFG-MS, and subjects with MS and IGT as (IGT-MS). We excluded subjects with previously diagnosed diabetes, as they have established cardiovascular risk and their inclusion as MS is controversial.
Statistical Analysis
The demographic characteristics of study participants are presented as mean +/- SEM. Since VF, HMW Adiponectin and the other biomarkers were not normally distributed; Mann-Whitney test was used to test the differences between subjects with the MS and controls. Spearman’s correlations were used to examine correlations between VF, HMW Adiponectin and the other biomarkers. Logarithmic transformations of the biomarkers were used in One Way ANOVA to compare the differences in VF and HMW adiponectin levels between the subgroups of the MS and the controls. Also, logarithmic transformations of the biomarkers were used in stepwise multiple regression analyses to identify the independent predictors of VF and HMW Adiponectin. All statistical analyses were performed using SPSS (SAS, Version 13). Statistical significance was set at P<0.05
Results
The baseline characteristics of the study subjects are shown in Table 1. As expected, subjects with MS had significantly higher BMI, Waist Circumference (WC), Fasting Plasma Glucose (FPG), Triglycerides (TGs) and Waist Hip Ratio (WHR). MS subjects were more insulin resistant compared to controls (Table 1). Systolic BP was marginally higher in MS subjects; LDL-cholesterol, total cholesterol and beta cell function (HOMA-B) were not different between the two groups. MS subjects had significantly higher FINDRISC score, indicating increased lifetime risk for developing type 2 diabetes [20].
Table 1. Baseline characteristics of the study subjects.
|
Biomarker † |
MS Subjects |
Controls |
P value‡ |
|
Age, Years |
43.5 ± 2.0 |
39.1 ± 1.8 |
0.133 |
|
BMI, kg/m2 |
30.7 ± 0.8 |
27.2 ± 0.8 |
0.002 |
|
Waist Circumference(WC), cm |
108 ± 2. |
96 ± 2 |
<0.0001 |
|
Waist: Hip Ratio(WHR) |
1.01 ± 0.1 |
0.97 ± 0.01 |
0.004 |
|
Systolic BP, mmHg |
137 ± 2 |
132 ± 3 |
0.08 |
|
Diastolic BP, mmHg |
85 ± 2 |
82 ± 2 |
0.17 |
|
Fasting plasma glucose, mmol/l |
5.4 ± 0.1 |
4.9 ± 0.1 |
0.012 |
|
HDL-Cholesterol , mmol/l |
1.06 ± 0.03 |
1.24 ± 0.1 |
0.005 |
|
Triglycerides, mmol/l |
1.8 ± 0.1 |
1.1 ± 0.1 |
<0.0001 |
|
Total Cholestrol, mmol/l |
5.13 ± 0.13 |
5.06 ± .016 |
0.56 |
|
Fasting Insulin, pmol/l |
60.6 ± 4.5 |
51.9 ± 11 |
0.004 |
|
HOMA-IR |
1.15 ± 0.08 |
0.96 ± 0.1 |
0.004 |
|
HOMA % B |
90.1 ± 5 |
88.5 ± 8.2 |
0.29 |
|
HOMA % S |
101.6 ± 8 |
160.9 ± 16.6 |
0.003 |
|
FindRisk Score |
10 |
6 |
0.002 |
|
Visfatin (VF), ng/ml |
98.2 ± 29.7 |
141.4 ± 39.1 |
0.041 |
|
HMW Adiponectin, ng/ml |
4103 ± 610 |
4074 ± 434 |
0.36 |
† Data presented as mean ± SEM. SEM=Standard error of the mean. ‡ P value obtained from Mann Whitney test.
Plasma Visfatin and HMW Adiponectin
Subjects with the MS had significantly reduced circulating concentrations of plasma VF compared to controls (98.2 ± 29.7 vs.141.4 ± 39.1 ng/ml, P=0.041), as shown in Table 1. One Way ANOVA showed that subjects with the MS and pre-diabetes (IFG/IGT) had significantly lower VF concentrations 60.8 ± 35.9 ng/ml when compared to controls(141 ± 39.1 ng/ml), P =0.009), and marginally lower VF concentrations when compared with subjects with the MS and normal glucose metabolism(133.2 ± 46 ng/ml), P=0.05, as shown in Figure 1. Likewise, Mean HMW adiponectin levels were similar between the two groups(4103 ± 610 ng/ml in MS subjects vs. 4074 ± 434 ng/ml in controls, P=0.36). One-Way ANOVA showed that subjects with MS and pre-diabetes had slightly lower concentrations of HMW adiponectin compared to both subjects with MS and normal glucose tolerance and controls, however, it did not reach statistical significance (Table 3).
Table 2. Spearman’s correlations between plasma VF, HMW Adiponectin and the different biomarkers in the whole group.
|
Biomarker |
Visfatin |
HMW adiponectin |
|
Weight |
r = -0.316, P=0.016 |
r = -0.13, P=0.43 |
|
BMI |
r= -0.30, P=0.02 |
r = -0.05, P=0.68 |
|
WC |
r= -0.33, P=0.012 |
r = -0.07, P=0.60 |
|
Age |
r= -.26, P=0.053 |
r = 0.10, P=0.43 |
|
SBP |
r = -0.15, P= 0.26 |
r = -0.09, P=0.46 |
|
DBP |
r = -0.23, P=0.07 |
r = 0.08, P=0.53 |
|
TGs |
r = – 0.08, P =0.52 |
r = -0.19, P= 0.15 |
|
FPG |
r = -0.32, P = 0.015 |
r= -0.04, P=0.70 |
|
Fasting insulin |
r= 0.15, P=0.28 |
r = 0.16, P=0.22 |
|
HOMA-IR |
r = 0.15, P=0.27 |
r= -0.17, P=0.20 |
|
HOMA % B |
r =0.09, P=0.48 |
r = 0.48, P=0.22 |
|
HDL-C |
r = -0.10, P=0.41 |
r = 0.46, P=0.0001 |
|
FINDRISC score |
r = -0.26, P=0.052 |
r =0.09, P=0.51 |
Table 3. One Way ANOVA. Plasma Visfatin and HMW Adiponectin levels according to metabolic syndrome status and glucose metabolism.
|
Biomarker |
Controls N=(29) |
NGT+ MS N=(15) |
IFG/IGT+MS (N=14) |
P value |
|
Mean plasma Visfatin, ng/ml |
141.4 ± 43 |
133.2 ± 46 ∂ |
60.8 ± 35.9 ¥ |
|
|
Mean plasma HMW Adiponectin, ng/ml |
4074.4 ± 433.6 |
4592.8 ± 920 |
3613.6 ± 812 |
NS |
|
HOMA-IR |
0.96 ± 0.2 |
0.97 ± 0.1 |
1.3 ± 0.1∞ |
|
|
HOMA % S |
160.9 ± 16.7 |
118 ± 11.7 |
82.8 ± 8.5 Ω |
|
|
HOMA % B |
88.5 ± 8 |
100.7 ± 7 |
77.8 ± 5.7 |
NS |
One way ANOVA comparing mean Visfatin and HMW Adiponectin concentrations between the groups.
NGT+MS: Normal Glucose Tolerant Subjects with Metabolic Syndrome.
IGT+MS: Impaired Glucose Tolerant Subjects with the Metabolic Syndrome.
IFG+MS: Subjects with Metabolic Syndrome and Impaired Fasting Glucose.
¥P value < 0.009 between controls and IFG/IGT+MS.
∂ P =0.05 between NGT+MS and IFG/IGT+MS.
NS: No Significant difference between the groups P > 0.05.
∞ P value= 0.011 between controls and IFG/IGT+MS.
Ω P value < 0.009 between controls and IFG/IGT+MS.
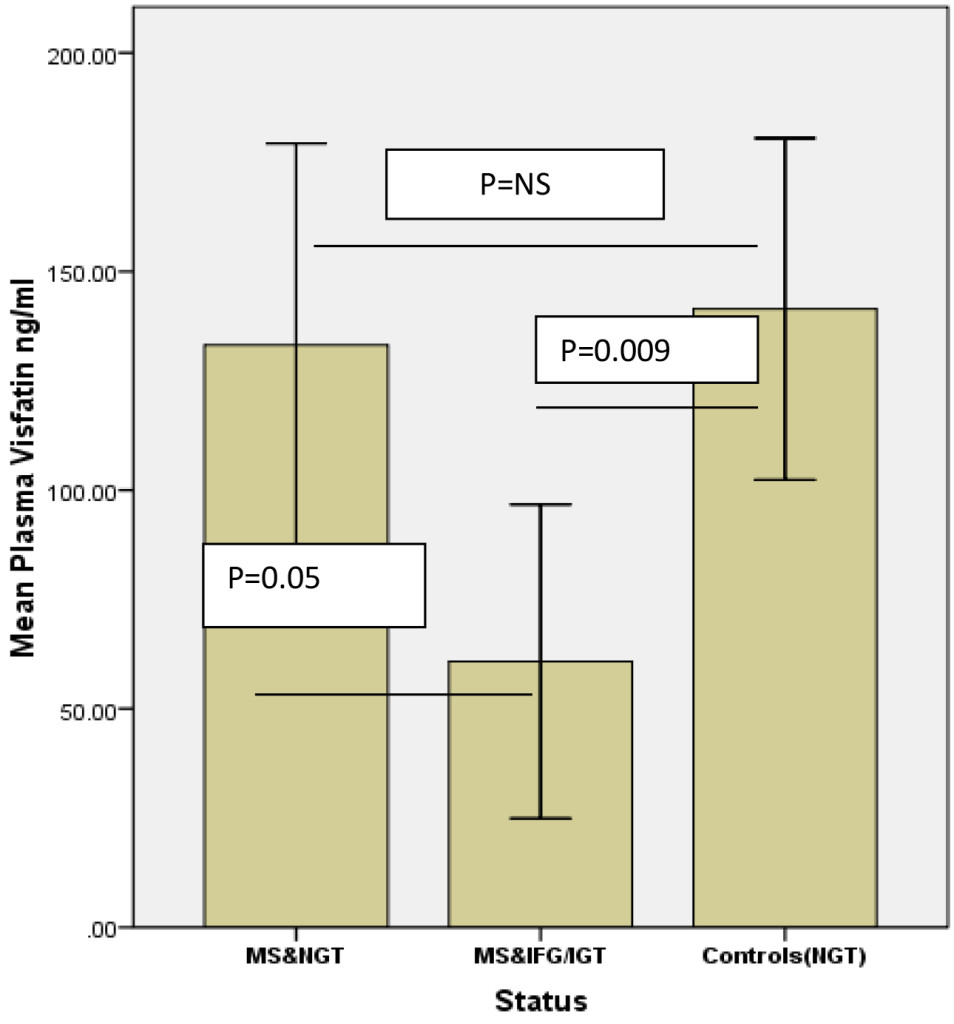
Figure 1. One Way ANOVA comparing mean Visfatin concentrations between the groups.
NGT MS: normal glucose tolerance metabolic syndrome; IGT: impaired glucose tolerance; IFG: impaired fasting glucose. NS: not significant. Error bars represent standard error of the mean.
Correlations between Visfatin, HMW adiponectin and other biomarkers
Spearman’s correlations between VF, HMW adiponectin and the different biomarkers are shown in Table 2.
In the whole group, VF negatively correlated with FPG ( r= -0.31, P=0.015), WC (r= -0.32, P=0.012), Weight (r=-.316, P=0.016) and BMI (r= -0.30, P=0.02), as shown in Table 2. There was a negative correlation between plasma VF and the FINDRISC score with marginal statistical significane (r=-.26, P=0.052). In MS subjects alone , VF negatively correlated with FPG, (r= -0.34 p=0.018).
VF did not correlate with fasting insulin, HOMA-IR or HOMA-B in either group.
HMW adiponectin levels positively correlated with HDL-Cholesterol (HDL-C) in MS subjects (r= 0.43, P=0.02), as well as in the whole group (r= -0.46, P <0.0001). In MS subjects alone, HMW adiponectin negatively correlated with fasting insulin(r=-0.40, P=0.037) and HOMA-IR (r=-0.40, P=0.038).
There was no significant correlation between VF and HMW adiponectin in the whole group or in each group seperately.
Multiple stepwise regression analysis showed that log WC was negatively and independently associated with VF, in a model that included log VF as the dependenet variable, and log WC, log FPG and log fasting TGs as independent variables. This model showed an R2 of 0.100 and P=0.016. β-coefficient was -3.522. WC explained 10 % of VF variance. Likewise, log HDL-C was positively and independently associated with log HMW Adiponectin in a model that included HMW Adiponetin as the depenent variable and log HOMA-IR, log HDL-C and log WC as independent variables. β-coefficient: 1.42, P=0.001. log HDL-C explained 19.7 % of the variation in log HMW adiponectin.
Discussion
In the present study, we showed that male subjects with increased cardiometabolic risk profile and insulin resistance had significantly reduced concentrations of plasma VF, which negatively correlated with FPG, WC, weight and BMI . Moreover, we showed that subjetcs with the MS and pre diabetes had very low concentrations of plasma VF not only when compared to controls, but also when compared to subjects the MS and normal glucose tolerance, although with marginal statistical significnace. In addition, we showed a non-significnat trent of a negative correlation between plasma VF and the FindRisk score, which suggests that lower concentations of plasma VF may be associated with increased lifetime risk of developing type 2 diabetes but this oservation requires further clarification in a larger study. The inverse and independant association between plasma VF and WC in the stepwise regression may indicate an indirect relationship between reduced plasma VF concentrations and the risk of developing type 2 diabetes and cardiovascular disease, however, again this requires further exploration in future studies as causality could not be assumed from our cross-sectional study. Several studies have explored the relationship between VF and the MS in the past few years with conflicting results. In agreement with our study, plasma Visfatin/Nampt levels has been shown to be reduced in patients with MS and type 2 diabetes in one study [21]. Most studies repored increased plasma VF concentration was shown to be increased in subjects with MS in two previous studies [11, 22–24]. Three more studies found no association between plasma VF and the MS [12, 25, 26]. It is worthwhile mentioning that the patient characteristics and/or the criteria for defining the MS were different in all the three studies mentioned above and this may have affected the results. The mechanisms underlying the association between low plasma VF concentrations and the MS in our study are not fully understood, however, a possible mechanism may be through the modification of the activity of the downstream target, SIRT1 which may be supported by the findings of De Kreutzenberg and colleagues, who showed that subjects with the MS and increased insulin resistance had reduced SIRT1 gene and protein expression [27]. Moreover, the same authors showed that high glucose and palmitate concentrations resulted in downregulation of Nampt (Visfatin expression, a reduction in intracellular NAD (+) levels and a reduction in SIRT1 activity in mononuclear cells from subjects with MS [27]. A more recent study by Yoshino and colleagues reported that Nampt-mediated NAD+ biosynthesis is severely compromised in both diet and age-induced models of diabetes in mice [28] . Interestingly, the authors showed that Nicotine Mononucleotide ( NMN), the product of Nampt reaction, was effective to treat the two different animal models of diabetes [28]. Moreover, Revollo and colleagues showed that Nampt is essential for normal beta cell function when they demonstrated that Nampt (+/-) heterozygous mice had defects in both NAD biosynthesis and glucose-stimulated insulin secretion (GSIS) [9]. Interestingly, Nampt (+/-) heterozygous mice developed impaired glucose tolerance and the administration of NMN (the product of Nampt reaction) corrected the defects in GSIS and restored normal glucose tolerance. In our study, we did not find any correlation between fasting plasma VF and insulin sensitivity measured by HOMA-IR, which is in agreement with several other studies which showed lack of association between Plasma VF and insulin resistance [29–31]. We found no correlation between Plasma VF and beta cell function measured by HOMA-B neither in the controls nor in subjects with the MS. The relationship between VF and beta cell function is being explored by some authors since VF is important for glucose-stimulated-insulin secretion from beta cells. One study in animals showed that VF reduced the degree of apoptosis of beta cells due to exposure of cell lines to interferon Gamma [32]. However, in human beings serum VF has been shown to increase with progressive beta cell failure in healthy males in a previous study, again adding to inconsistency of evidence regarding this molecule [33]. Several studies described significant increase in plasma VF concentrations after different types of bariatric surgery in morbidly obese subjects [34–36]. Moreover, Haider and colleagues showed that treatment with the insulin sensitizer rosiglitazone increased both plasma VF and adiponectin in HIV-positive, insulin resistant subjects [37]. However, opposite results have also been reported where plasma VF has been shown to decrease after bariatric surgery as well [38] . Therefore, it is difficult to draw any conclusions about whether is beneficial or reduced levels of plasma VF are useful or harmful, unlike the case with adiponectin, where low levels have been consistently shown to be associated with type 2 diabetes, insulin resistance, and the risk for cardiovascular disease in may studies [39–41] . We may speculate that previously described increased concentrations of plasma VF in some studies in subjects with type 2 diabetes, MS and obesity may represent a compensatory mechanism to increase GSIS and improve glucose tolerance. Another explanation for the inconsistencies in published work on VF could be due to differences in immunoassays used by different research groups, as previously reported by Korner and colleagues [42]. A Third explanation for the inconsistency in VF work may be due to the presence of two iso-forms for eNampt (monomeric and diameric forms) and it has been shown that serum monomeric eNAMPT levels were elevated in HFD-fed mouse models of diabetes, whilst eNAMPT-dimer levels were unchanged. Very interestingly, eNAMPT-monomer neutralisation in HFD-fed mice with anti-monomeric eNampt antibodies resulted in lower blood glucose levels, amelioration of impaired glucose tolerance and whole-body insulin resistance, improved pancreatic islet function, and reduced inflammation [43]. Therefore, investigators should cleary indicate in future studies what iso-form of VF/Nampt was measured . We expected to see lower concentrations of plasma HMW adiponectin in subjects with the MS however, this may be due to the small sample size, however, HMW adiponectin was negatively correlated with HOMA-IR in subjects with the MS in our study, which is in agreement with previous studies that described association of reduced HMW adiponectin isoforms with the risk of insulin resistance and type 2 diabetes. There was no correlation between VF and HMW Adiponectin in this study but a previous study described a negative correlation between plasma Adiponectin and VF in patients with Rheumatoid Arthritis [44].
We acknowledge that this study has some limitations including the small sample size, the cross-sectional design and the use of HOMA-IR and HOMA-B as crude measures for assessing of insulin sensitivity and beta cell function, respectively. Also lack of simultaneous measurement of VF and HMW Adiponectin mRNA expressions in visceral and subcutaneous fat depots and their correlation with serum levels is yet another limitation.
In conclusion, we report reduced circulating concentrations of plasma VF in subjects with the MS compared to age and gender-matched controls, with extremely low concentrations of plasma VF in subjects with the MS and pre-diabetes. The findings of this study point towards a possible relationship between reduced concentrations of plasma VF and increased cardiometabolic risk and pre-diabetes , however, it is not clear from this study whether low plasma VF concentrations acts as a mediator or a marker of cardio metabolic risk and pre-diabetes. Further mechanistic studies are needed to explore this important relationship.
Acknowledgement
We would like to thank the Construction Workers’ Health Trust and all the study volunteers for their participation in this study. Many thanks to the staff nurses in the metabolic research unit
Funding
This study was funded by the Diabetes Education and Research Fund and the CWHT.
Authors’ contribution
Imad Brema: Study design and conception, data collection, statistical analysis, manuscript writing
Hood Thabit: Data collection, manuscript writing
Shabahat Shah: Data collection, manuscript writing
Nicole Burns: Data collection, manuscript writing
Declan Gasparro: Laboratory analysis of plasma samples for glucose, lipids, insulin
Vivion Crowley: Laboratory analysis,
Angela Storka: Visfatin and HMW Adiponectin assays
Michael Wolzt: Visfatin and HMW Adiponectin assays, manuscript writing
John J Nolan: Study design, data analysis, manuscript writing.
Abbreviations
CWHT: Construction Workers’ Health Trust
GSIS: Glucose-Stimulated-Insulin Secretion
HFD: High Fat Diet
HOMA-B: Homeostasis Model Assessment for Beta Cell Function
HOMA-IR: Homeostasis Model Assessment for Insulin Resistance Index
IDF: International Diabetes Federation
IFG-MS: Impaired Fasting Glucose Subject with Metabolic Syndrome
IFG: Impaired Fasting Glucose
IGT-MS: Impaired Glucose Tolerant Subject with Metabolic Syndrome
IGT: Impaired Glucose Tolerance
IL-6: Interlukin-6
MS: Metabolic Syndrome
Nampt: Nicotinamide Phosphoribosyl transferase
NAD: Nicotinamide Adenine Dinucleotide
NGT: Normal Glucose Tolerance
NGT-MS: Normal Glucose Tolerant Subject With Metabolic Syndrome
NMN: Nicotinamide Mononucleotide
OGTT: Oral Glucose Tolerance Test
PBEF: Pre-B- Colony Enhancing Factor
Sir1: Silent Information Regulator 1
VF : Visfatin
References
- Kershaw EE, Flier JS (2004) Adipose tissue as an endocrine organ. J Clin Endocrinol Metab 89: 2548–2556. [crossref]
- Arner P (2005) Insulin resistance in type 2 diabetes — role of the adipokines. Curr Mol Med 5: 333–339. [crossref]
- Fantuzzi G (2005) Adipose tissue, adipokines, and inflammation. J Allergy Clin Immunol 115: 911–919. [crossref]
- Fukuhara A, Matsuda M, Nishizawa M, Segawa K, Tanaka M, et al. (2005) Visfatin: a protein secreted by visceral fat that mimics the effects of insulin. Science 307: 426–430. [crossref]
- Samal B, Sun Y, Stearns G, Xie C, Suggs S, et al. (1994) Cloning and characterization of the cDNA encoding a novel human pre-B-cell colony-enhancing factor. Mol Cell Biol 14: 1431–1437. [crossref]
- Revollo JR, Grimm AA, Imai S (2004) The NAD biosynthesis pathway mediated by nicotinamide phosphoribosyl transferase regulates Sir2 activity in mammalian cells. J Biol Chem 279: 50754–50763.
- Wang T, Zhang X, Bheda P, Revollo JR, Imai S, et al. (2006) Structure of Nampt/PBEF/visfatin, a mammalian NAD+ biosynthetic enzyme. Nat Struct Mol Biol 13: 661–662. [crossref]
- Lim SY, Davidson SM, Paramanathan AJ, Smith CC, Yellon DM, et al. (2008) The novel adipocytokine visfatin exerts direct cardioprotective effects. J Cell Mol Med 12: 1395–403.
- Revollo JR, Korner A, Mills KF, Satoh A, Wang T, et al. (2007) Nampt/PBEF/Visfatin regulates insulin secretion in beta cells as a systemic NAD biosynthetic enzyme. Cell Metab 6: 363–375.
- Filippatos TD, Derdemezis CS, Kiortsis DN, Tselepis AD, Elisaf MS (2007) Increased plasma levels of visfatin/pre-B cell colony-enhancing factor in obese and overweight patients with metabolic syndrome. J Endocrinol Invest 30: 323–326.
- Zhong M, Tan HW, Gong HP, Wang SF, Zhang Y, et al. (2008) Increased serum visfatin in patients with metabolic syndrome and carotid atherosclerosis. Clin Endocrinol (Oxf) 69: 878–884.
- Lin CC, Lai MM, Li TC, Li CI, Liu CS, et al. (2009) Relationship between serum retinol-binding protein 4 and visfatin and the metabolic syndrome. Diabetes Res Clin Pract 85: 24–29.
- Ntzouvani A, Fragopoulou E, Panagiotakos D, Pitsavos C, Antonopoulou S (2016) Reduced circulating adiponectin levels are associated with the metabolic syndrome independently of obesity, lipid indices and serum insulin levels: a cross-sectional study. Lipids Health Dis 15: 140.
- Wang W, Xing W, Zhang H, Ding M, Shang L, et al. (2013) Reduced high-molecular-weight adiponectin is an independent risk factor for cardiovascular lesions in hypercholesterolaemic patients. Clin Endocrinol (Oxf) 78: 539–544.
- Hojlund K, Frystyk J, Levin K, Flyvbjerg A, Wojtaszewski JF, et al. (2006) Reduced plasma adiponectin concentrations may contribute to impaired insulin activation of glycogen synthase in skeletal muscle of patients with type 2 diabetes. Diabetologia 49: 1283–1291.
- Thabit H, Burns N, Shah S, Brema I, Crowley V, et al. (2013) Prevalence and predictors of diabetes and cardiometabolic risk among construction workers in Ireland: the Construction Workers Health Trust screening study. Diab Vasc Dis Res 10: 337–345.
- Chen MP, Chung FM, Chang DM, Tsai JC, Huang HF, et al. (2006) Elevated plasma level of visfatin/pre-B cell colony-enhancing factor in patients with type 2 diabetes mellitus. J Clin Endocrinol Metab 91: 295–299.
- Levy JC, Matthews DR, Hermans MP (1998) Correct homeostasis model assessment (HOMA) evaluation uses the computer program. Diabetes Care 21: 2191–2192.
- Alberti KG, Zimmet P, Shaw J; IDF Epidemiology Task Force Consensus Group (2005) The metabolic syndrome–a new worldwide definition. Lancet 366: 1059–1062. [crossref]
- Lindström J, Tuomilehto J (2003) The diabetes risk score: a practical tool to predict type 2 diabetes risk. Diabetes Care 26: 725–731. [crossref]
- Schindler K, Vila G, Hoppichler F, Lechleitner M, Luger A, et al. (2012) The impact of type 2 diabetes on circulating adipokines in patients with metabolic syndrome. Obes Facts 5: 270–276. [crossref]
- Filippatos TD, Derdemezis CS, Gazi IF, Lagos K, Kiortsis DN, et al. (2008) Increased plasma visfatin levels in subjects with the metabolic syndrome. Eur J Clin Invest 38: 71–72. [crossref]
- de Luis DA, Aller R, Gonzalez Sagrado M, Conde R, Izaola O, et al. (2013) Serum visfatin levels and metabolic syndrome criteria in obese female subjects. Diabetes Metab Res Rev 29: 576–581.
- Kocelak P, Olszanecka-Glinianowicz M, Owczarek AJ, Krupa W, Obirek P, et al. (2015) Plasma visfatin/nicotinamide phosphoribosyltransferase (visfatin/NAMPT) concentration in elderly subjects with metabolic syndrome. Polskie Archiwum Medycyny Wewnetrznej 125: 402–413.
- Guducu N, Isci H, Gormus U, Yigiter AB, Dunder I. (2013) Serum visfatin levels do not increase in post-menopausal women with metabolic syndrome. J Endocrinol Invest 36: 157–161.
- Jialal I, Devaraj S, Kaur H, Adams-Huet B, Bremer AA (2013) Increased chemerin and decreased omentin-1 in both adipose tissue and plasma in nascent metabolic syndrome. J Clin Endocrinol Metab 98: 514–517.
- de Kreutzenberg SV, Ceolotto G, Papparella I, Bortoluzzi A, Semplicini A, et al. (2010) Downregulation of the longevity-associated protein sirtuin 1 in insulin resistance and metabolic syndrome: potential biochemical mechanisms. Diabetes 59: 1006–1015.
- Yoshino J, Mills KF, Yoon MJ, Imai S (2011) Nicotinamide mononucleotide, a key NAD(+) intermediate, treats the pathophysiology of diet- and age-induced diabetes in mice. Cell Metab 14: 528–536. [crossref]
- Pagano C, Pilon C, Olivieri M, Mason P, Fabris R, et al. (2006) Reduced plasma visfatin/pre-B cell colony-enhancing factor in obesity is not related to insulin resistance in humans. J Clin Endocrinol Metab. 91: 3165–3170.
- Brema I, Hatunic M, Finucane F, Burns N, Nolan JJ, Haider D, et al. (2008) Plasma visfatin is reduced after aerobic exercise in early onset type 2 diabetes mellitus. Diabetes, obesity & metabolism 10: 600–602.
- Dogru T, Sonmez A, Tasci I, Bozoglu E, Yilmaz MI, et al. (2007) Plasma visfatin levels in patients with newly diagnosed and untreated type 2 diabetes mellitus and impaired glucose tolerance. Diabetes Res Clin Pract 76: 24–29.
- Xiang RL, Mei M, Su YC, Li L, Wang JY, et al. (2015) Visfatin Protects Rat Pancreatic beta-cells against IFN-gamma-Induced Apoptosis through AMPK and ERK1/2 Signaling Pathways. Biomed Environ Sci 28: 169–177.
- Lopez-Bermejo A, Chico-Julia B, Fernandez-Balsells M, Recasens M, et al. (2006) Serum visfatin increases with progressive beta-cell deterioration. Diabetes 55: 2871–2875.
- Krzyzanowska K, Mittermayer F, Krugluger W, Kopp HP, Schernthaner G (2006) Increase in visfatin after weight loss induced by gastroplastic surgery. Obesity (Silver Spring) 14: 1886–1889.
- Garcia-Fuentes E, Garcia-Almeida JM, Garcia-Arnes J, Garcia-Serrano S, Rivas-Marin J, et al. (2007) Plasma visfatin concentrations in severely obese subjects are increased after intestinal bypass. Obesity (Silver Spring) 15: 2391–2395.
- Botella-Carretero JI, Luque-Ramirez M, Alvarez-Blasco F, Peromingo R, San Millan JL, et al. (2008) The increase in serum visfatin after bariatric surgery in morbidly obese women is modulated by weight loss, waist circumference, and presence or absence of diabetes before surgery. Obes Surg 18: 1000–1006.
- Haider DG, Schindler K, Mittermayer F, Müller M, Nowotny P, et al. (2007) Effect of rosiglitazone on visfatin and retinol-binding protein-4 plasma concentrations in HIV-positive patients. Clin Pharmacol Ther 81: 580–585. [crossref]
- Haider DG, Schindler K, Schaller G, Prager G, Wolzt M, et al. (2006) Increased plasma visfatin concentrations in morbidly obese subjects are reduced after gastric banding. J Clin Endocrinol Metab 91: 1578–1581.
- Hara K, Yamauchi T, Imai Y, Manabe I, Nagai R, et al. (2007) Reduced adiponectin level is associated with severity of coronary artery disease. Int Heart J 48: 149–153.
- Linscheid P, Christ-Crain M, Stoeckli R, Reusch CE, Lutz TA, et al. (2008) Increase in high molecular weight adiponectin by bariatric surgery-induced weight loss. Diabetes Obes Metab 10: 1266–1270.
- Otto C, Otto B, Goke B, Pfeiffer AF, Lehrke M, Vogeser M, et al. (2006) Increase in adiponectin levels during pioglitazone therapy in relation to glucose control, insulin resistance as well as ghrelin and resistin levels. J Endocrinol Invest 29: 231–236.
- Körner A, Garten A, Blüher M, Tauscher R, Kratzsch J, et al. (2007) Molecular characteristics of serum visfatin and differential detection by immunoassays. J Clin Endocrinol Metab 92: 4783–4791. [crossref]
- Kieswich J, Sayers SR, Silvestre MF, Harwood SM, Yaqoob MM, et al. (2016) Monomeric eNAMPT in the development of experimental diabetes in mice: a potential target for type 2 diabetes treatment. Diabetologia
- El-Hini SH, Mohamed FI, Hassan AA, Ali F, Mahmoud A, et al. (2013) Visfatin and adiponectin as novel markers for evaluation of metabolic disturbance in recently diagnosed rheumatoid arthritis patients. Rheumatol Int 33: 2283–2289.