Abstract
In six parallel studies, selected as relevant for education from a total of 35 studies about ‘giving’ (Give It! project), respondents evaluated the appeal of messages for donations to education causes. These specific causes included, respectively, Importance of Reading, Education about Art, Technical Education, Art in Education, Alumni Efforts and University Scholarships. In each study, respondents recruited by an online panel recruited provide 70-80 respondents in each study. Each respondent selected the study of interest from a list and participated in the study they selected. Respondents each evaluated unique sets of 60 vignettes, created from 36 elements, presented in different combinations for each respondent, with the vignettes created according to an underlying design, permuted for each respondent. The pattern of results revealed three different mind-sets cutting across the six studies. These three mind sets were: MS1 (Commitment) Because I Care….it’s about what I can personally do to make the issue better; MS2 (Actions) Showing Support It takes more than just effort and good wishes to make things change… it takes money, time, items’; MS3 (Effect) It Makes a Difference….it’s about what can be done to help those affected by the issue. The discovery of mind-sets, and their presence in different proportions in the six studies, suggest that on a practical level communications seeking donations for the various education causes would be best served by mixing together strong performing and mutually compatible messages appealing to each mind-set.
Introduction
In 2002 author Moskowitz along with Jacquelyn Beckley and Hollis Ashman of the Understanding and Insight Group, Inc. created a set of studies called ‘Give It!’ The objective was to use the emerging science of Mind Genomics to create a database of patterns of response to messages about ‘charitable donations.’ The focus of these then-called ‘It!” studies was to explore the way people responded to these messages with the aim of uncovering basic mind-sets in the population. The previous studies in the It! series dealt with foods (Crave It!), beverages (Drink It!), and insurance (Protect It!), as well as anxiety (Deal With It!), and shopping (Buy It!). The Give It! studies, funded by the O’Grady Foundation, broke new ground in understanding the messages which would drive people to say that they were intrigued. The focus was not to drive giving, but rather to find out the messages that would put people into a positive frame of mind for a specific cause.
The rationale underlying the It! studies was the recognition that our knowledge of what drives donations is extensive, but piecemeal. In the words of a recently published paper [1]:
“Charities operate in a highly fragmented environment with many players competing for individuals’ support. The limited resources available for campaign development (creative, filming) and execution (media planning, on-air time) means that charity marketers need to use the most effective principles to ensure return on investment. Commercial marketers can use clear guidelines published on how to execute the brand to enhance advertising effectiveness and, more specifically, brand recall and recognition. Whether such guidelines are adhered to by charity marketers is unclear as no known research exists on this topic.”
A glance into the academic literature through Google Scholar® for the phrase charitable donation messaging reveals 21,200 as of this writing (Fall, 2021), with the academic literature focusing on general theory of why people give, and in turn, messaging which works. This focus on trying to understand the deeper WHY something works is admirable because it increases our understanding of the mind of people. Thus, it should come as no surprise that the academic literature focuses on the general types of messages used for different causes, the modes of donating e.g., Chen [2], and of course the nature of the giver. As in most academic studies of these social issues, the objective is to work from the top down, from general classes of ideas to the effectiveness of those ideas in particular uses [3]. Thus, one might see studies focusing on ‘guilt’ as a topic of the message, and its effectiveness. For example, consider crowd funding for a cause. Chen [4] reported that three types of messages work best: guilt, utilitarian products, and emotion messaging, respectively. Do we find this troika reflected in giving for causes?. Occasionally one might encounter papers dealing with specific phrasing, but the focus on the performance of such phrase is motivated by the fact that the phrase itself is unusual (e.g., even a penny will help; Shearman) [5].
Moving further, from the general to the particular, we find that in a great deal of the scientific literature there does not seem to be a systematic review of the power of specific messages, as a focus of the research, although one might speculate that such information is a staple of private databases used for seeking donations. It is there, in the world of the everyday specifics, the world of the granular, that Mind Genomics makes its mark, and its contribution.
The Mind Genomics Approach
To understand Mind Genomics and the large topic of ‘giving’ we first turn to the world of conventional research and specifically the types of experiments that are done. In the world of conventional research, a typical experiment to understand the mind of the ‘giver’ for creates an experiment with one or two conditions, often exaggerated changes of what might occur in everyday life, executes the experiment, and determines which antecedent method drives the greater amount of the criterion response. This traditional approach creates its knowledge base by aggregating together the results of such isolated experiments, establishing the pattern by a meta-analysis of these many findings. There may be a desire to create a library of practical information, ‘vetted’ by science, but the one-at-a-time process allows such library to emerge years, often decades after the data has been collected, the individual experiments reported, and then re-considered as a totality to create the library.
Mind Genomics differs from the conventional methods in worldview, execution, and types of data collected, and types of inferences made, respectively. Mind Genomics focuses on decision rules emerging from systematic experiments with many variables, doing so in ways which have become rapid, scalable, affordable, and amenable to iteration. Mind Genomics presents the respondent with many systematically varied messages, each respondent evaluating a different set of messages. It is the pattern of responses to the set of systematically varied combinations which provides the necessary data, but only after the pattern id deconstructed into the contribution of the individual messages. At a more global level, Mind Genomics looks for patterns across stimuli, and for emergent groups in the same topic area who show meaningfully different patterns of responses to the same set of stimuli. These are so-called mind-sets, appearing again and again across all topics explored by Mind Genomics, with the natures of the mind-sets driven by the topic itself [6-8]. These mind-sets vary in nature by category (nature of product, nature of service), and most important, clearly transcend most conventional ways of dividing people (viz., gender, age, country etc.). During the past 30 years, since 1993, Mind Genomics have evolved from a one-off system for research, based on conjoint analysis, to a templated system set up so that anyone can become a researcher. We present here the template adapted to the set of studies run in 2002 [9-11]. Note that processes which started out manual, such as combining files for the ‘reporting’ have become totally automated as of this writing.
The Mind Genomics Research Process Applied to the World of Giving
Step 1 – Select the Topics about ‘Giving’ to Explore
Figure 1 shows the 35 topics. At the time of the actual study the respondent would select the topic of interest, go to the study, and then participate. The topic would ‘disappear’ from the wall after a certain number of respondents completed the study. Unknown to the respondent, the ‘test material’ viz., the ‘elements, ‘ viz., phrases, full set of studies were almost mirror image of each other across the 35 different studies except for eight of 36 elements which were specific to the topic.
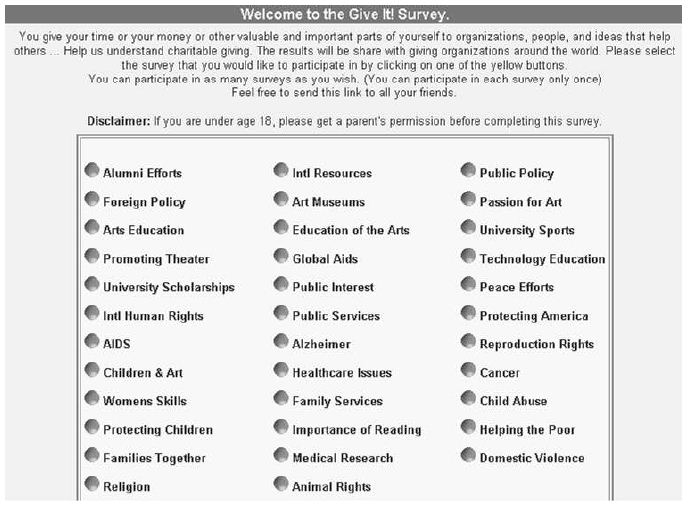
Figure 1: The wall of 35 Give It! studies. The respondent selected the study and was led to the actual Mind Genomics experiment corresponding to the study
Step 2 – Create the Basic Structure of the Experiment, Comprising a Specific Number of ‘Questions, and a Specific Number of Answers’ for Each Question
The IT! studies conducted during the first five years 2001-2005 used four questions, each with nine answers, or in the language of today’s Mind Genomics, four questions, and nine elements (answers). The choice of this 4×9 experimental design was based upon the joint desire to acquire as much information as possible, and the popularity of Mind Genomics designs around 2003, the early phrase of the internet in consumer research.
The designs had to fall into the class of permuted experimental designs, which could be created in the hundreds, so that each respondent would evaluate answers (elements), albeit in different combinations. That structure, allowing for strong individual-level analysis, pre-determined the set of viable design structures. Table 1 presents the 36 different messages, groups into four categories, or in today’s usage, four questions. Each category (or question) comprises nine elements (or answers). It is critical that a group of related elements, viz., elements of the same type but which may carry different information, just appear in the same category or question. This requirement is a ‘bookkeeping device’ to ensure that two elements of the same type, but containing mutually contradictory information, can never appear together, since the vignette specifies as much. The elements or answers are direct statements, painting a word picture. As the vignettes will show below, simple one- or two-word answers to a question do not suffice to paint a word picture. The objective was to create answers or elements, which in combination, painted such a word picture without the need of a question to set the stage.
Table 1: The 4 questions or categories, and the 36 answers or elements, nine per question/category. The elements pertain to supporting alumni efforts.
| Code | What is the goal of giving? |
| A1 | You can make a difference |
| A2X | Sharing a love of your college/university with others |
| A3X | Ensuring that students become productive citizens |
| A4 | Your support ensures strong communities and strong families |
| A5X | To provide tools for complete learning |
| A6X | Because everyone knows that supporting schools is important |
| A7X | To enhance the quality of life on campus |
| A8X | To ensure the richness of culture |
| A9 | Helping to maintain standards of excellence |
| How do you give? | |
| B1 | You can give by cash or check donations |
| B2 | You can even use your credit card to donate |
| B3 | Show your support by attending special events |
| B4 | Having a gift matched by your employer |
| B5 | Show your support through a pledge program |
| B6 | Offer your support through regular attendance |
| B7 | Support the organization by purchasing items they sell or need |
| B8 | Volunteer! |
| B9X | You support an individual trying to impact higher education |
| How do you and how do the recipient benefit? | |
| C1 | Gain an association with the organization |
| C2 | Build a connection to other donors |
| C3 | Get the benefits of a tax deduction |
| C4 | Participate in group endeavor |
| C5 | Encouraging yourself and others to participate in a worthwhile project |
| C6 | Giving is a part of your family tradition |
| C7 | Fulfilling a religious obligation to help others |
| C8 | Realizing your personal belief |
| C9 | Preserving the vitality and the future of the program |
| What are emotional and real outcomes? | |
| D1 | Because you want to “DO” good |
| D2 | Be seen, be heard, be an active part! |
| D3 | Be appreciated |
| D4 | A great way to network |
| D5 | Be associated with an organization you believe in |
| D6X | Ensure that a strong interest in supporting alumni efforts remains a priority |
| D7 | Because you want to honor a loved one |
| D8 | Donating time, money and effort makes a difference |
| D9 | Be with people who share your interests |
It is important to keep in mind that any large-scale investigation of a vertical, such as donations with Give It!, must sacrifice a great deal of the specifics of a cause in the interests of comparability of causes. The objective of Mind Genomics applied to the vertical is to discover general patterns from sets of common elements. The alternative approach, doing individual studies for each topic, would provide deeper information, but the meta-analysis of the results might require a great deal more effort, and require involve luck at the end, rather than planning at the start. In Table 1, eight of the 36 elements have an ‘x’ added to their code. These are elements which are similar across the six different mind-sets, but also contain topic-specific language that was changed in a minor fashion from study to study.
Step 3 – Create Small, Easy to Read Vignettes, Using an Experimental Design
Step 3 creates the test stimuli, the combinations f messages. In the language of Mind Genomic, these combinations are called vignettes. Figure 2 shows an example of a vignette. The stimuli comprise 60 different combinations, all similar in format to Figure 2, except that some comprised two elements, some three elements, and some four elements. The spacing and design of the vignette is such that the respondent could easily read the vignette. Experience with Mind Genomics suggest that the combination of messages in a spare form, with open space allows the respondent to quickly ‘graze’ the information and make a rating. The design of the test stimulus in Figure 2 goes contrary to approaches, which present the respondent with a crafted paragraph. In the end, comments from respondents who, having been presented with these spare looking vignettes like that of Figure 2, concur that it is easier, less fatiguing, less frustrating to deal with form of design when rating many vignettes, rather than working one’s way through what a dense paragraph.
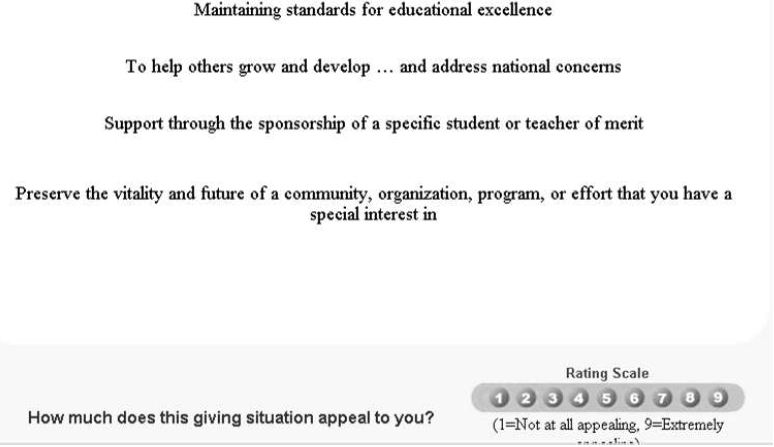
Figure 2: Example of a vignette comprising four elements
The vignette is created according to an underlying experimental design [11]. The design prescribes the exact composition of each vignette, specifying which specific elements are combined. To the novice unfamiliar with the design structure, such as the respondent, the vignette looks as if the elements had been thrown together at random. The truth is precisely the opposite. The compositions are carefully crafted to ensure that each element appears equally often, that each element is statistically independent of every other element, and that there are sufficient of compositions or vignettes which lack one or two elements. The latter feature of the experimental design ensures the data can be used by OLS (ordinary least=squares ) regression to deconstruct the response into the contribution of the individual 36 elements. Furthermore, the built-in incompleteness of some vignettes prevents the statistical problem of multi-collinearity, which would eventuate in the crash of the statistical analysis for that data set. Finally, and most important, the coefficients emerging from the OLS regression have ratio-scale values, and are comparable from study to study, from period to period, and even across different individuals. Two other features of the experimental design are important to note. The first is that no question or category can contribute more than one element to a vignette. The rationale for this constraint is that quite often the question or category comprises elements which mutually contradict each other. Were these mutually contradictory elements to appear in the same vignette they would corrupt the response to the vignette. The second significant feature in the Mind Genomics system is the permutation of the basic design, so that the mathematical structure is identical, but the actual combinations differ from one another. The use of the permuted design at first seems to be merely a statistical enhancement, but the reality is that it is a frontal attack on some of the thinking of conventional science, and an alternative to the oft-quoted proverb ‘measure nine times and cut once.’ This permuted design (Gofman and Moskowitz) emerged out of a recognition that the standard research approaches are based on reducing statistical error by repeating the same experiment with dozens or hundreds of people. The implicit assumption of the conventional research procedure is that the ‘correct answer’ is known, and that the research is going to confirm or disconfirm that guess. Yet, the ‘reality on the ground’ is that no one really knows what messages will work, and what messages will fail to work. Thus, the choice of the messages and the combinations becomes one’s best guess. The permuted design avoids the need to select a limited set of vignettes, or test combinations at the start of the study. The key benefits of the permuted design used by Mind Genomics are ability to explore a wide number of alternative ideas (36 in this study), and at the same time explore a great deal of the underlying ‘design space’ of different combinations. Each respondent evaluated a unique set of 60 vignettes. Across the approximate 70-80 respondents, this means that for each topic (e.g., technical education), the Mind Genomics experiment investigated the response to many different vignettes, albeit each vignette evaluated just a few times The creation of a model relating the presence/absence of the elements to the ratings was stabilized because of the many different combination. Even if one or several, or several dozen were mis-judged, the weight of the approximate 60×75, viz. 4500 judgments of different combinations sufficed to ensure that no systematic error could affect the result. In contrast, conventional research testing the same 60 vignettes 75 times each might be well advised to make sure that the 60 vignettes are the correct vignettes. Choosing the wrong single vignette to test or having an aberrant reaction to that vignette is not quite as serous in Mind Genomics as it is for conventional research. To summarize this point, it should thus be kept in mind that the permutation of the combinations ensures a wide coverage of the possible combinations, producing a better experiment. It is simply very difficult to introduce a strong bias when the combinations change all the time. It is the underlying pattern, emerging for 4800+ vignettes which is critical.
Step 4: Invite the Respondent to Participate, Introduce the Respondent to the Subject, and Execute the Actual Interview
The It! studies were run with the Canadian on-line panel, Open Vue Ltd. Their panel comprised both USA respondent and Canadian respondents, among many others. The respondents were selected to be residents of the United States. Open Vue sent out email invitations to its panelists. Those who answered were led to the screen shown in Figure 1, where they selected a study of interest to them. During this early period of research with Mind Genomics and with the It! studies, it became obvious that an efficient way to do 35 studies with approximately similar numbers of respondents was to let the respondent choose the study. Once the study quota was filled, the study disappeared from the available choices. Figure 3 shows the orientation screen for the study. Most of the screen is taken up with bookkeeping details, about the length of the study, the fact that the screens (viz., the vignettes) differ, the rating question, and the expected time of the study. During this early period of internet research, the respondents were not yet saturated by requests to participate in simple studies or evaluations of their experience, and thus were more likely to donate 15 minutes of their time to the study. Nonetheless, it was important to incentivize the respondent with a monetary reward, a drawing for a prize. The three prizes were the incentive across all 35 studies. That is, all respondents across all studies were entered into the drawing, and three respondents were selected as winners.
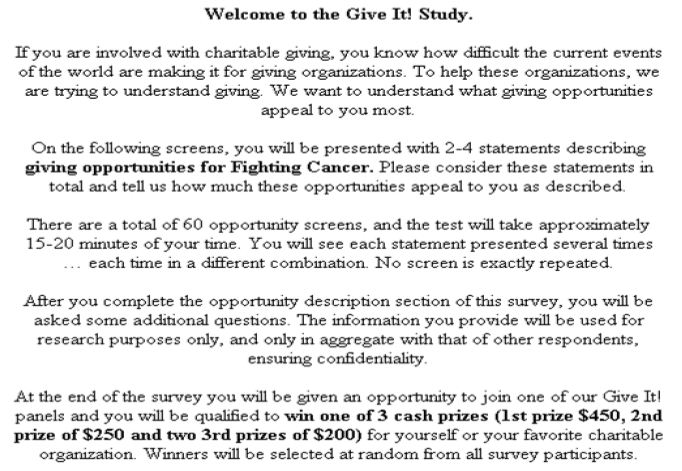
Figure 3: The orientation page for the Give It! studies. Each study was introduced by the same page, with the only difference being the specific topic.
Step 5- Transform the Rating to a Binary Dependent Variable and Create Individual-level Models
The respondent rated each vignette on the simple scale ‘How much does this giving situation appeal to you?’ Note that the respondent was not asked to state whether or not the respondent would donate, or how much, although those could have been legitimate questions to ask. Rather, the respondent was asked a question about feelings, about a sense of ‘appeal to me.’
The 9-point scale, a category or Likert Scale, can be easily analyzed. The problem with the scale, however, is how to interpret the scale. When managers receive data, they often ask the simple question ‘what do these ratings MEAN?’. To a manager, the fact that one can easily analyze the data with sophisticated statistics means very little when the results cannot be easily understood and acted upon. Thus, it has become standard procedure to transform these Likert scales, usually to a binary scale, yes/no. The manager using the data has no problem understanding yes/no. The transformation is straightforward. Standard practice has evolved to transforming the ratings of 1-6 to 0, and ratings of 7-9 to 100. This division of the scale makes thee interpretation easier. As a prophylactic measure, we add a vanishingly small, random number to every transformed variable to ensure that the transformed variable, viz., the newly created binary variable, has some minimal variation. If the respondent were to rate all 60 vignettes as 7-9, or as 1-6, respectively, then the transformation as just specified would create a set of 60 number, all 100, or all 0, respectively. The analysis of the data by OLS (ordinary least squares) regression would immediately crash. Adding a vanishingly small random number to the newly created binary value ensures that this unhappy event does not occur. Every vignette will have its own number, around 100 or around 0, respectively, depending upon the original rating assigned to the vignette. Once the data have been transformed the 60 rows of data from each respondent is subjected to an OLS (ordinary least squares) regression. The regression is called ‘dummy variable’, because each of the 36 element corresponds to an independent variable, and takes on only one of two values, 0 or 1, as follows: The element is either present in or absent from a vignette, so its corresponding independent variable is coded ‘1’ when present, or coded ‘0’ when absent.
The equation is: Binary (0/100) = k0 + k1(A1) + k2(A2) .. k36 (D9)
The regression analysis created 60 rows of input data for each respondent. Each row comprised 37 numbers, additive constant (k0) and the 36 coefficients, k1-k36. With 453 respondents participating, the regression analysis generated 453 rows of coefficients. It would be these 453 rows of coefficients that would be used to create mind-sets. The 453 rows, viz. the full data set, was subject to k-means clustering, the inputs for the clustering being the 36 coefficients k1-k36. The additive constant was not used for the clustering. To make the analysis easier, we extracted three clusters, a number usually found to reveal strong patterns, but not unwieldy to analyze. The clustering was done by the k-means method [12], which looks at the distance between each pair of respondents and tries to put respondents into a set of mutually exclusive groups so that the distance between the respondents in a cluster is small, while at the same time the distance between the centroids of the three clusters is large. The clustering does not take into account any of the ‘meaning’ of the elements, but simply tries to satisfy a mathematical criterion. Table 1 shows eight elements with the element code having an ‘x’ as the suffix. These were elements deemed too specific to the topic and were not included in the clustering. The rationale was that the clustering should comprise only those elements common in meaning to the six different topics of giving. These eight elements did not satisfy that criterion of being ‘topic-agnostic.’ They will, however, be presented in the results. Within any group, whether total, donation topic, mind-set or topic x mind-set, the corresponding additive constants and 36 coefficients were averaged to generate the results shown in the data tables. More recent approaches simply combine data together for the respondents in a defined group and rerun the regression model on the total data for the relevant group. The results are similar for both forms of analysis.
Results
Total Panel and the Six Different Topics
The Mind Genomics analysis generates a substantial amount of summary data. Our objective is to discover patterns and generalities, not to show all of the data, which would hide the patterns which exist. In order to make the discovery task simpler, we will eliminate from consideration all elements with coefficients of +7 or lower and report the element when it has a coefficient of +8 or higher. The element will not appear at all in the case that all of the coefficients for the key subgroups are lower than +8. This pruning action brings the really important elements into the foreground. Table 2 presents the results from the total panel, combining the six studies, and all of the respondents. The additive constant is 41, meaning that on average two of five responses to the vignettes will be rated as appealing (viz., rated 7-9 on the nine-point sale). The messages range from belief in the organization (D5) to affiliation (A2X), to focus on the recipient (A3X). These are the key messages that any organization seeking donations should incorporate.
Table 2: Strong performing elements from the total panel, combining all respondents across the six studies.
|
Total |
||
| Additive Constant |
41 |
|
| D5 | Be associated with an organization you believe in |
9 |
| A2X | Sharing a love of your TOPIC with others |
9 |
| A3X | Ensuring that TOPIC become productive citizens |
8 |
The array of strong performing elements increases when we move from combining all the data into one group (Total) and do the analysis on a topic-by-topic basis. The results appear in Table 3. Once again the table shows only those elements which generate at least one coefficient of +8 or higher. Thee first data column shows the sum of the strong performing coefficients and used to sort the elements from strongest performing elements to the weakest performing elements. In addition, the six studies are sorted by the magnitude of the additive coefficient, viz., the likelihood to find the vignette appealing in the absence of elements. Stated differently, the additive constant might be considered to represent the basic proclivity of the respondent towards the topic.
Table 3: Strong performing elements for each of the six giving topics.
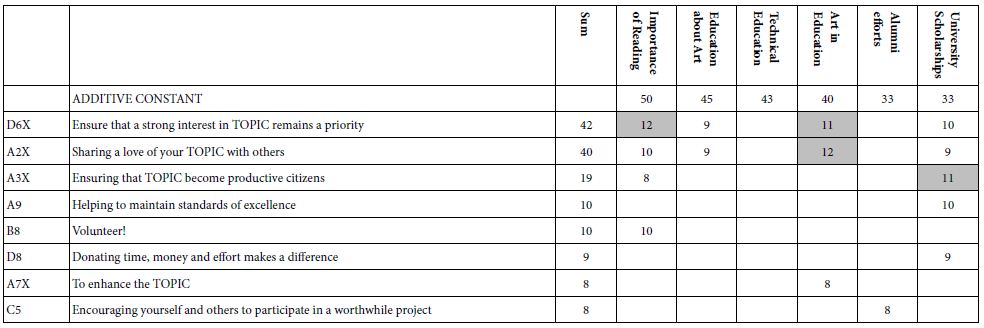
The additive constants suggest that the most appealing topic is ‘importance of reading’, the least, but still strong being university connected topics, ‘alumni efforts’; and ‘university scholarships’, respectively. One of the properties of Mind Genomics is the fact that the coefficients have ratio scale properties. Thus, we can conclude that ‘importance of reading’ is 50% more appealing than the two university topics. Table 3 is characterized by a great number of blank spaces, suggesting that the strong performing elements do not transcend the different topics. No element drives strong appeal to more than three of the six topics The two strongest elements appear to focus on different directions, first a focus on the topic itself (D6X), and second a focus on the social aspects (A2X). There is a third focus, that of helping the person who is associated with the giving cause. These three directions suggest three different foci of appeal, directions which will emerge as mind-sets
D6X: Ensure that a strong interest in TOPIC remains a priority
A2X Sharing a love of your TOPIC with others
A3X: Ensuring that TOPIC become productive citizens
Moving from Total to Mind-sets
Table 3 hinted at the possibility that there might be different ways of evaluating the messages. Although at first glance we might consider the key factor to be the recipient of the donation so that certain topics are more attractive than another, there might be a far deeper factor at work, mind-sets. The hallmark of Mind Genomics is the discovery of these different patterns of response to messaging. The metaphor is white light, which seems to be colorless, but when the light is diffracted through a prism, the spectrum of colors emerges. We see white perhaps because the different colors interfere with each other. Mind Genomics posits that for virtually all conventional aspects of daily experience, there are different patterns of focus, of importance. What one person thinks to be important (viz., more is better) another person might as consider to be utterly irrelevant, even off-putting. The discovery of these groups, so-called mind-sets, it a matter of experiment. Furthermore, once these mind-sets are established through analysis, some of the data begins to make more sense. We may hypothesize about the possible mind-sets, but an easier way to establish these mind-sets is through a set of experiments, such as the experiments run here. The analysis to establish these mind-sets is simple OLS regression as we have done, followed by clustering to create groups of individuals with similar patterns of responses. The set of individual coefficients comprises raw material for the creation (or discovery) of these mind-sets, the permuted experimental design provides us with what we need to create the individual-level set of coefficients. As discussed above, the OLS regression analysis was straightforwardly able to create an individual level model for each of the 453respondents. The OLS regression estimated the additive constant and the value of each of the 36 coefficients, one coefficient for each element. Table 1 showed the expression of the elements for the topic of Alumni Efforts. Eight of the 36 elements appear to be specific to the topic and are marked with an ‘X’ in the element code. As noted above, these eight elements will not be used to establish the mind-sets by clustering, but then will be included in the later analyses after the mind-sets are created. The clustering method of k-means created two clusters for the 453 respondents, and then created three clusters for the same 454 respondents. The clustering procedures are a purely objective one, attempting to satisfy certain mathematical criteria. The criteria previously adopted for Mind Genomics studies for choosing the appropriate number of clusters (now called mind-sets) are not statistical, but rather qualitative. The two criteria are that there be as few clusters or mind-sets as possible (parsimony), and that each mind-set tells a story (interpretability). The criteria suggested a three-cluster solution, rather than a two-cluster solution. These clusters become the mind-sets. The clustering itself was done, as noted, on 28 of the 36 elements. Once each respondent was assigned to a cluster or mind-set, it was straightforward to estimate the additive constant and the value of the coefficient for each of the original 36 elements. That is, we resort to the 28 ‘general’ elements ONLY to create the clusters or mind-sets, and then revert back to the full set of data for further interpretation.
Three segments emerged, based on a qualitative ‘sense’ of what is communicated by the strong preforming elements. No element is strong across all six giving topics, so the interpretation of the meaning of the mind-sets become a simple heuristic with which to discuss the results. Furthermore, the clustering does not dramatically separate the three mind-sets. It’s a matter of emphasis. This is important. The dynamics of appealing to the heart of the donor become a matter of combining messages of different types, rather than focusing on one specific factor, such as EFFECT (viz., the benefit to the recipient).
MS1 (Commitment) Because I Care….it’s about what I can personally do to make the issue better.
MS2 (Actions) Showing Support It takes more than just effort and good wishes to make things change… it takes money, time, items,
MS3 (Effect) It Makes a Difference….it’s about what can be done to help those affected by the issue.
The Baseline Proclivity of the Mind-sets towards ‘What Appeals’
The additive constant tells us the estimated rating of 7-9 (appeal to me), in the absence of elements. Although the additive constant is a purely estimated parameter, it can be used to indicate the proclivity of the respondents to say ‘appeals to me’. Table 4 presents the additive constants estimated separately for the six different causes, and the three mind-sets that were developed for all the causes combined. The additive constants are sorted by average, first in descending order of cause by averaged across the three mind-sets, and then by mind-set averaged across causes. There are remarkable differences in the additive constant of the three mind-sets and in the six studies. The strongest ‘pull’ emerges from donations to help teach reading (average 50), and the weakest from alumni efforts (average 34) and university scholarship (32). This teaches us that the strongest pull, on average, is exerted by causes which pull toward young people, to give them an opportunity. Universities will have a more difficult time reaching the donors’ heartstring. In terms of the three mind-sets, we also see radical differences. Mind-Set 1 (commitment) shows the strongest proclivity to feel positive (additive constant 50), As the array is presented, there is also clear evidence for some interactions, specifically for reading. Mind-Set 2 (actions) finds its strongest pull with reading.
Table 4: Additive constants for the three mind-sets and the six donation ‘causes’, sorted by cause and by mind-set.
| Additive Constant |
MS1 (Commitment) |
MS3 (Effect) | MS2 (Actions) |
Average |
| Reading |
49 |
41 | 60 |
50 |
| Tech Education |
58 |
45 | 34 |
46 |
| Ed in Arts |
51 |
40 | 44 |
45 |
| Arts Ed |
45 |
36 | 39 |
40 |
| Alumni Efforts |
47 |
41 | 13 |
34 |
| University Scholarship |
51 |
30 | 14 |
32 |
Average |
50 |
39 | 34 |
What Elements ‘Drive’ Positive Feelings about Giving for the Three Mind-sets?
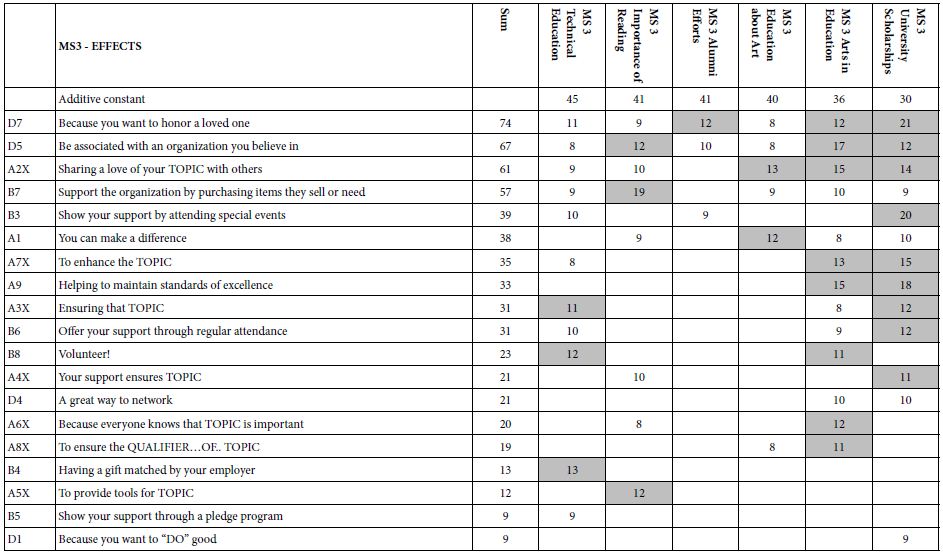
Tables 5-7 show the strong performing elements for each of the three mind-sets. Note again that the tables present only the strong performing elements for at least one of the three mind-sets, and that all elements were considered for inclusion. In the case of the eight elements which were topic-specific, the topic is replaced by the word ‘TOPIC.’ One gets a sense of the specific thrust of the communication by reading the complete element, even with the word ‘TOPIC’ replacing the actual topic.
Table 5: Mind-Set1: The table shows the strong performing elements for MS1, labelled ‘COMMITMENT’’.
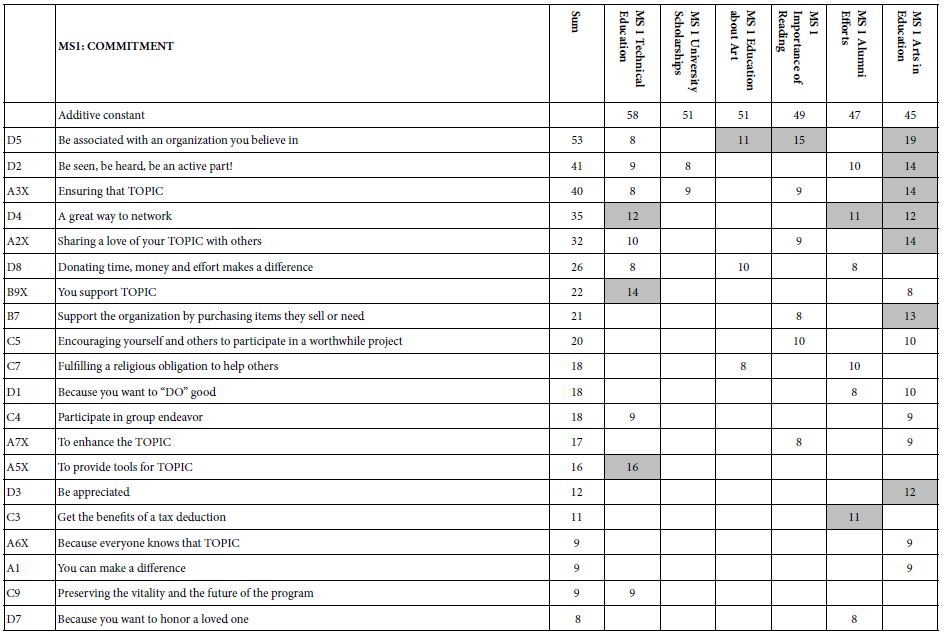
Table 6: Mind-Set 2. The table shows the strong performing elements for MS1, labelled ‘ACTIONS’.

Table 7: Mind-Set 3 . The table shows the strong performing elements for MS3, labelled ‘EFFECTS’.
The Composition of the Three Mind-sets
A hallmark of conventional research is that WHO a person is often covaries with what a person does or what a person believes. It is for this reason that so many consumer researchers spend a great deal of time collecting so-called classification questions about the respondent. What attracts many conventional researchers is the possible covariation of the easy-to-measure-behavior with additional information about the respondent.
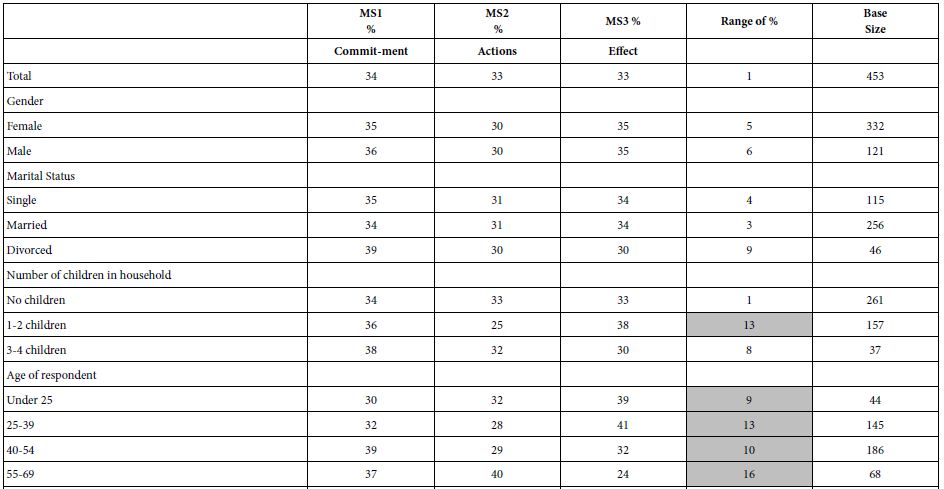
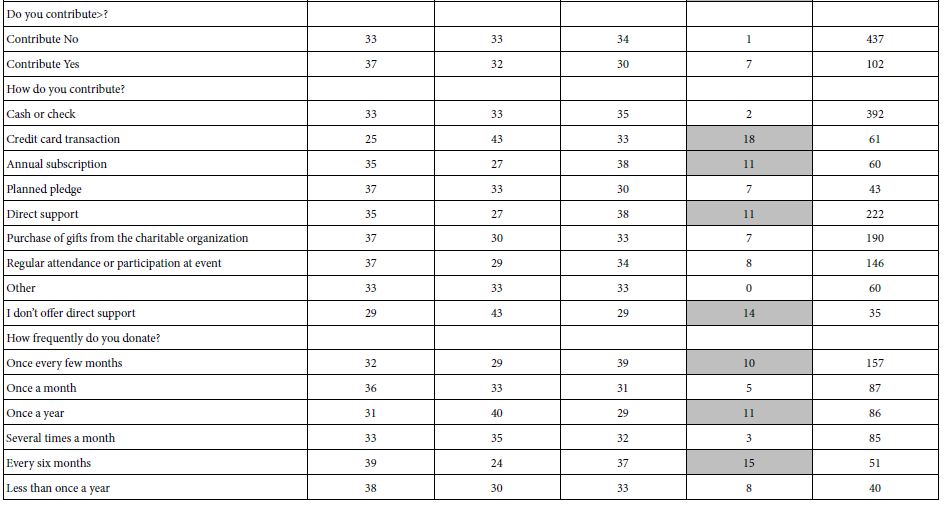
In the world of Mind Genomics, the focus is on a better understanding of the individual. Only secondarily is the focused on establishing the relation between who a person IS versus, what the person THINKS To a great degree the lack of focus on the covariation between mind-set and behavior is due to the belief that the most pressing task is to understand the mind-sets, rather than to link the scarcely understood mind-sets to other variables. The It! studies captured a great deal of individual level data regarding attitudes and behaviors involving ‘giving’. Some of the data appears in in Table 8. Table 8 shows the complicated relationship between the three mind-sets and both WHO the person is, as well as how the person BEHAVES with respect to donating to causes. There are many patterns emerging, depending upon the way the respondent self-classifies, but no simple pattern which can be said to be common to the mind-sets.
Table 8: The percent of respondents in each of the three mind-sets, the range of percentages across the three mind-sets, and the base size. Each row constitutes a classification variable in the self-profiling classification.
Discussion and Conclusions
The academic study of ‘giving’ typically focuses on higher level motive, looking at the individual material from either actual campaigns, or creating an experiment. The important thing to note is that these studies generate a certain kind of knowledge, understanding the general drivers of donations. That information is important to understand donating to causes in the context of theories about why people do what they do. Being able to put a person’s ‘giving’ behavior, or response to different appeals allows the academic to understand yet another part of the mind of the person, for the world of the everyday. The Mind Genomics approach presented here, with its focus on the specific messages, give us a different point of view. The goal of Mind Genomics is to work with the stimuli of the everyday, in this study the stimuli being ‘messages.’ Rather than look for underlying patterns to fit into a theory, the effort is to identify what really works, and then point to what might be happening. Mind Genomics is atheoretical, but systematized experimentation. There is no theory in which to place the response patterns of giving, or at least no theory which drives the effort. Rather, the objective of the study is to see ‘what works’, with the test material being the type of messages that would be used in actual campaigns. The important results from this study are simple to summarize, namely that most of the messages really don’t work very well in terms of the ratings by respondents, and that the nature of the mind-sets which emerge is not a case of ‘polarization’ but rather ‘emphases. It’s not that the mind-sets respond only to one type of message, but rather the mind-sets respond to the messages, the elements, but some messages are stronger for one mind-set, and still positive but weaker for another mind-set. There is a strong practical side to the data presented here. That side is the fact that the patterns emerging from messages can be used immediately. There is no need to translate the test messages used in the experiment to actual messages that might be useful in a practical situation. The messages from the Mind Genomics experiment come from actual campaigns, although edited to have general application. Finally, the finding emerges once again that although there are mind-sets that are clearly different, there do not seem to be any simple co-variation of the mind-sets with who the respondent IS, or the self-stated patterns of involvement with the world of giving. It is that finding, a continuing revelation, which continues to surprise. The practice has always been to stratify the efforts by dividing people by WHO they are, assuming that people who appear similar on the criteria of who they are or how they involve themselves with the world of giving will be similar in their response to messages about giving. It just not the case.
Acknowledgments
These studies were run under the aegis of It! Ventures, Inc. The authors acknowledge the contribution of the late Hollis Ashman, as well as the contribution of Jacquelyn Beckley of the Understanding and Insight Group, New Jersey, USA. The studies were sponsored by Kathleen O’Grady of the O’Grady Foundation.
References
- Nguyen C, Faulkner M (2020) In pursuit of effective charity advertising: Investigating the branding and messaging execution tactics used by charity marketers. Third Sector Review 26: 66-87.
- Chen W, Givens T (2013) Mobile donation in America. Mobile Media & Communication 1: 196-212.
- Duncan T (1995) Why mission marketing is more strategic and long-term than cause marketing. In: 1995 AMA Winter Educators Conference: Marketing Theory and Applications, Vol. 6, (eds: Stewart D, David W, Vilcassim N, Chicago: American Marketing Association) 469-75.
- Chen S, Thomas S, Kohli C (2016) What really makes a promotional campaign succeed on a crowdfunding platform?: Guilt, utilitarian products, emotional messaging, and fewer but meaningful rewards drive donations. Journal of Advertising Research 56: 81-94.
- Shearman SM, Yoo JH ( 2007) “Even a penny will help!”: Legitimization of paltry donation and social proof in soliciting donation to a charitable organization. Communication Research Reports 24: 271-282.
- Luckow T, Moskowitz HR, Beckley J, Hirsch J, Genchi S (2005) The four segments of yogurt consumers: preferences and mind-sets. Journal of Food Products Marketing 11: 1-22.
- Foley M, Beckley J, Ashman H, Moskowitz HR (2009) The mind-set of teens towards food communications revealed by conjoint measurement and multi-food databases. Appetite 52: 554-560.
- Rabino S, Moskowitz H, Katz R, Maier A, Paulus K, et al. (2007) Creating databases from cross‐national comparisons of food mind‐ Journal of Sensory Studies 22: 550-586.
- Moskowitz HR, Gofman A, (2007) Selling Blue Elephants: How to make Great Products that People Want Before They Even Know They Want Them. Pearson Education.
- Moskowitz, H.R., Gofman, A., Beckley, J. & Ashman, H., (2006) Founding a new science: Mind genomics. Journal of Sensory Studies 21: 266-307.
- Lundstedt T, Seifert E, Abramo L, Thelin B, Nyström Å, et al. (1998) Experimental design and optimization. Chemometrics and Intelligent Laboratory Systems 42: 3-40.
- Likas A, Vlassis N, Verbeek JJ (2003) The global k-means clustering algorithm. Pattern Recognition 36: 451-461.