Abstract
The underlying physiological processes for tree activities in winter are still unclear, and changes occurring during the growing season have been observed mainly on the basis of tedious phenological research. Devices, constructed and tested in a 3-year cycle by the Department of Forest Sites and Ecology, allows for tracking the activity of a tree throughout the year by using integrated measurements of conductivity, temperature and air humidity. That can be tracked online (see web site https://thingspeak.com/channels/698713). Observations on the impacts to four tree species (Acer pseudoplatanus, Alnus glutinosa, Carpinus betulus, Fagus sylvatica), were made for when temperatures fall below 0°C, during the spring activity phase, during the maximum of summer activity and during the autumn decline in activity. Thanks to the conductivity measurement method, tracking the activity of the trees year-round is easy. The sensors showed that the trees were active (although at a low level) during the winter; the real dormancy period was noted when the air temperature dropped below – 5.7 Co. For some temperature values, the conductivity is inhibited both in winter and in summer. The described method in this paper of measuring the conductivity of a tree may be very useful for future research related to trees, phenology, climate change and other ecological research. It can also be used as a utility tool that may, for example, be of interest to producers of maple syrup, as it indicates the moment when trees enter the phase of its most intensive production.
Keywords
Conductivity, Tree phenology, Winter dormancy period
Introduction
Climate change and its causes and consequences are one of the most important themes of modern natural sciences. These changes are most visible, among others, in phenological studies. Phenology (the science that measures the timing of life cycle events for plants and animals) is strongly controlled by climate and has consequently become one of the most reliable bioindicators of ongoing climate change [1]. Equally, due to the climate change, over the past two decades there has been a renewed interest in the overall impact of phenological shifts in forest ecosystems, [2] but sometimes the beginning (or end) of a season or a phenophase is difficult to define[3]. Unambiguously determining the factors trigging phenological phases is even more difficult. Some authors have suggested that the life cycle phases of plants, such as bud bursting, leafing or flowering are linked to the chilling period length [4–6], while others are linked to the photoperiod, [7-10] temperature of the previous autumn [11], nutrient availability [12], precipitation [13,14], humidity [15] or light regime [16]. An overwhelming number of phenological studies have confirmed that temperature is the main driver for phenological events, [17] while all other factors are supposed to capture some of the remaining, unexplained variance. The underlying physiological processes for this temperature sensitivity remain unclear, and temperature sensors for budburst have not yet been found [18,19]. Generally, high volumes of data have indicated a prolonged vegetative period in plants growing in a temperate climate, [20–23] and the changes in the development phases of trees during the growing season are widely understood, but our knowledge of trees entering the winter dormancy period is limited. The aim of the current paper was to show the potential of using conductivity as a measure of tree activity during a long-term period in an ecological approach. Additionally, the following hypotheses were set for the current research study:
- Trees species differ in their measured conductivity values,
- Conductivity can be a measure of differences in the daily and seasonal activities of trees,
- Trees can remain active during the “dormancy period”,
- Conductivity can be a useful tool in determining the correlation between tree activities and factors such as temperature and humidity.
The electrical conductivity of any medium is proportional to the number and mobility of its electrical charges (i.e., ions, dissociated molecules, and surface absorbed ions). During the conduction of an electric current, the ionic charges do not move and the passage of the electric current (including in plant tissues) is achieved by transferring the induced electromagnetic field between neighbouring ions, regardless of whether they are free or attached to the membranes or cell wall surfaces. The path of the current in healthy tissues is through channels of the cell walls, resulting in a current that is related to impedance due to the separation of charges (ions) at tissue boundaries [24]. The existing methods for measuring the flow of fluids in trees illustrate the water management of plants and determine the intensity of transpiration of a single tree. Currently, the most common method of measuring the flow of fluids in trees is the thermal method, which uses the measurement of the water flow rate in the tree trunk. This is called “sap-flow,” which consists of delivering a single or long-lasting heat pulse to the stem and measuring the temperature of the fluid at a short distance over the heated trunk zone. The use of sap-flow techniques requires the use of an energy-consuming heating element, which limits the use of these devices over a long period in most field conditions. The individual sap-flow methods also have limitations in capturing slow and fast flows [25]. Sap flow sensors are a low-cost and practical option to measure tree transpiration. However, there remain significant errors with theoretical and empirical equations that aim to directly estimate transpiration from thermal based measurements. The heat pulse velocity based methods are excellent in correlating relative changes in transpiration rates but exhibit large errors in estimating amounts of transpiration. Where whole plant water use or the amount of transpiration is of primary interest, sap flow sensors must be calibrated [26] and due to some model assumptions, it does not reflect the daily and seasonal activity of trees. Trees in temperate climate zones, due to environmental and mainly climatic factors, undergo periods of active growth and rest [27]. Tree activity is regulated by biochemical processes that change the chemical composition of the cellular cytoplasm and permeability (fluidity) of cell membranes [28]. These processes are also reflected in the sap-flow and the changing rate of its flow both throughout the day and the whole year, in connection with the regulation of the water management of the plant. Thanks to their anatomical structure, trees can transport water with mineral salts (xylem vessels) and nutrients (phloem vessels). The transport of electrolyte juices (a substance capable of conducting electricity) is a feature that only living organisms possess, and the transport intensity depends on the activity of a given tree. Dry wood is a dielectric and does not conduct electricity. Using these properties, the Department of Forest Sites and Ecology (Poznań University of Life Sciences, Faculty of Forestry) has constructed a set of sensors (ConTeH) that automatically register the tree conductivity, temperature and humidity at an assumed time interval. Following long term testing, sensors were first placed in beech and sycamore trees, and then in alder and hornbeam trees in natural conditions. The aim of the paper was to show the potential of using conductivity measurements as the method of registering the daily and seasonal activity and the method’s effects on environmental and ecological studies. This study’s results should help in understanding the environmental factors trigging tree phenology and may possibly assist in increasing the ease and precision of phenology research. Sanders-DeMott and Templer [29] wrote that “the influence of winter climate change on ecosystem responses to warming may have important implications for our understanding of terrestrial ecosystem function in a changing climate”, called “for the integration of established winter climate change methods with ecosystem-scale warming approaches in regions with seasonal snow cover” and highlighted “the need for additional attention to the gap in our understanding of how climate change across seasons influences ecosystem processes”. We believe that the method and the results described in our manuscript may help fill this gap.
Methods
Data Logger Description
The device used in this study is a compact data logger that comprehensively records microhabitat factors such as temperature, relative humidity and light intensity. The sensor has also been equipped with an innovative measurement system for the physiological activity of trees that examines the electrical properties of their living tissues. The device records changes in the electrical conductivity of a tree between the probes placed in its trunk (Figure 1). The control processor at every defined time interval activates a generator that sends a current pulse with alternating characteristics to the probes (to avoid electrolysis). Depending on the conductivity of the resulting system (probe-tissue-tree-probe) to the microcontroller returns a signal of unique frequency, which is a measurement of the conductivity of the tree. The device can be powered by the built-in rechargeable battery from a photovoltaic cell integrated to the device, thereby ensuring constant, stabilized voltage from three 1.5 V batteries. The device has an electrically erasable memory that allows uninterrupted recording of the data set for 270 days. The device’s accurate temperature-compensated, real-time clock system is in operation, which starts the procedure of measuring and recording data at a strictly defined time. Complementing the apparatus is a General Packet Radio Service (GPRS) module sending data to the server, which transmits the results to the indicated mobile devices (smartphone, tablet, laptop). The idea of the device is to create a capacitor with a wooden dielectric between the probes of the device. Due to the constant transport and movement of sap-flow in the tree, the dielectric properties of the system (probe-wood-probe) depend on the amount of sap-flow in the pores (vessels) of the wood. The microcontroller, which has a fixed time interval (1 hour), uses a generator to pulse a small, alternating electric field on the device probes. Being analogous to conductometry (which is used only in liquids) and solutions used in the measurement of admittance, to avoid an unfavourable electrolysis phenomenon between the probes, the presented solution was also used to pass through the alternating current system. Depending on the amount of electrolyte (plant juice) present in the phloem and xylem, the electrical capacity of the system is unique, and thus demonstrates the value of the current flowing between the probes. The consequence of the different capacities of the system is the different amount of current conduction through the wood tissue. Variable values of the flowing current, which reflect the activity of the trees and is expressed in Hz (during the first tests – mV) affect the frequency of the generator. Because the cell chemistry and the rate of transpiration are variable over a 24-hour period, as well as annually, this measurement is the determinant of the tree’s activity at a given moment. During the growing season, depending on the species, these values range (also within 24 hours) from a few hundred to approximately 4000 Hz. With the decrease in activity, the number of Hz decreases to the minimum level recorded by the device of 50 Hz (equivalent to approximately 20 pF (picofarad)) corresponding to the lack of conductivity, which indicates the cessation of processes responsible for transport and active change in the chemical composition of vegetable juice. The device additionally records the date and time of the measurement along with microclimatic parameters, i.e., air temperature and relative humidity.
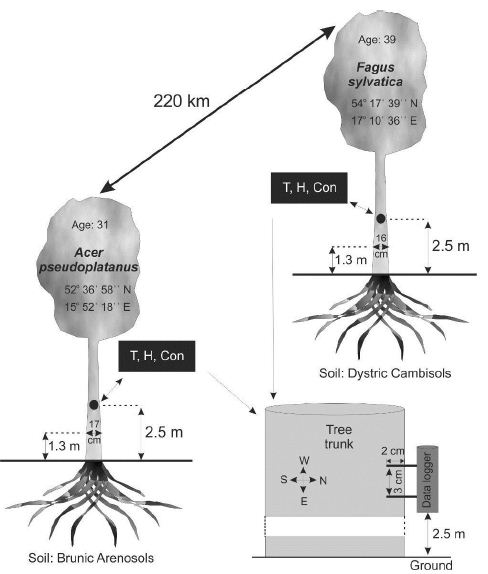
Figure 1: Characteristics of the examined trees. T, H, and Con in the graph mean temperature, humidity and conductivity measured by the data loggers, respectively.
Tree Selection
The prototype of the device was developed for research studying the causes of mass beech (Fagus sylvatica) bark stripping by deer in the northern part of Poland.
The second prototype device was mounted on sycamore (Acer pseudoplatanus). This species was chosen due to intensive production of sap, similar to popular maple syrup usually made from the xylem sap of sugar maple and other maple species. The difference between juice leakage in beech and sycamore is clearly visible when wounding the trees in spring, but no measurements have been made so far.
The method of embedding devices on trees and the features of the trees and their locations are given in Figure 1. Trees of similar height, circumference and age were chosen.
The devices were mounted at a height of 2.5 m, on the north side of both types of trees so that direct light would not fall on them.
Results
The results of measurements received between April 8, 2016 to August 8, 2016 were quite intriguing. In addition to the assumed effects, among which both species of trees showed a low early spring conductivity, high conductivity in the summer and a definite difference in the conductivity between beech and sycamore (Figure 2), an anomaly was also noted. This anomaly contained an almost simultaneous reaction from both trees, manifested by a rapid, short-lived increase in conductivity (Figures 2 and 3) on April 12-13, 2016 and April 16-17, 2016.
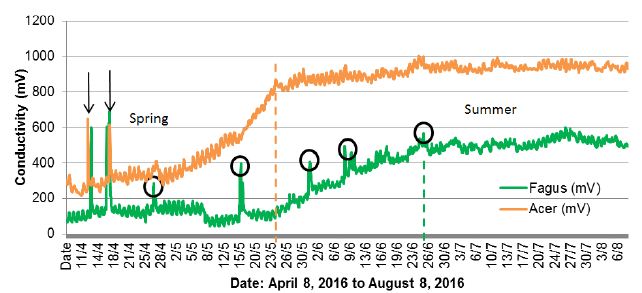
Figure 2: Changes in conductivity in sycamore and beech trees in the period from April 8, 2016 to August 8, 2016.
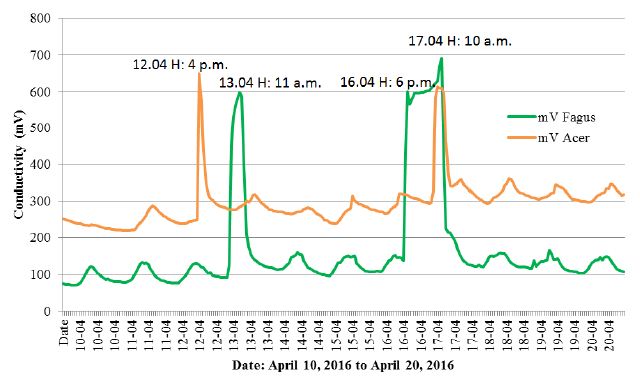
Figure 3: Enlarged section of Figure 2, with the anomaly periods.
The two black arrows indicate an anomaly in the course of the graph, constituting an identical reaction of sycamore and beech growing 220 km away from each other (Figure 1). The vertical dashed lines (brown and green) mark the entry of trees in the summer period, when they were full of tree activity after the period of spring leaf development. The black circles indicate other peaks of Fagus conductivity. An enlarged section of Figure 2 with anomalies is given in Figure 3.
This coincidence for both tree species was not observed after April 17, but after this date additional interesting changes are still visible in the beech graph, according to the following dates: April 26, May 16 and 31, June 8, 16 and 24 (Figure 2). Explaining such rapid changes of tree activity with the influence of air temperature or air humidity is difficult, as at the time there was standard variability in the weather conditions prevailing in the spring in Poland, with warm days and cool nights (Figure 4). A correlation between the indicated anomalies and the intensity of storm phenomena [30] and moon phases was not found either.
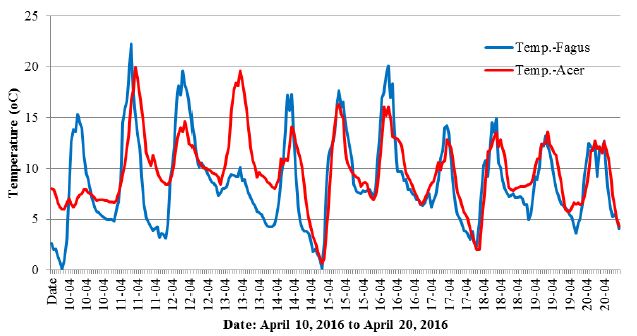
Figure 4: Changes in the air temperature for the period shown in Figure 3.
Preliminary results proved to be highly promising in terms of the reaction of trees to changing environmental conditions, so they were used for long-term observations of changes that occur in other tree species. The result of a year-round conductivity measurement cycle is shown for Alnus glutinosa (Figure 5). This species was selected due to its different life cycle, which, as in all deciduous species in Poland, depends on the seasons; however, the black alder additionally depends on the hydrological cycle and is characterized by significant fluctuations in the depth of the groundwater table, from water occurring on the surface to a depth of 140 cm below ground (Figure 5).
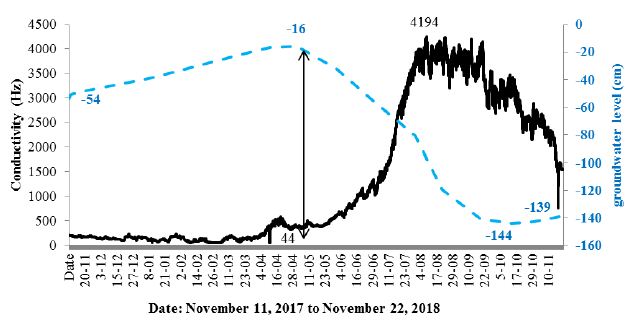
Figure 5: Changes in conductivity in an alder tree and the groundwater table at the edge of an alder forest between November 11, 2017 to November 22, 2018.
In addition to the conductivity, data were collected on the course of changes in air temperature (Figure 6) and air humidity (Figure 7).
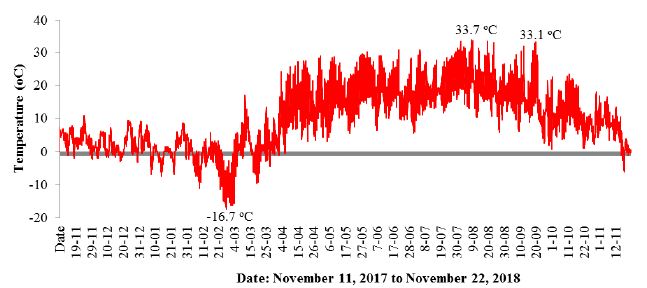
Figure 6: Changes in air temperature in an alder forest between November 11, 2017 to November 22, 2018.
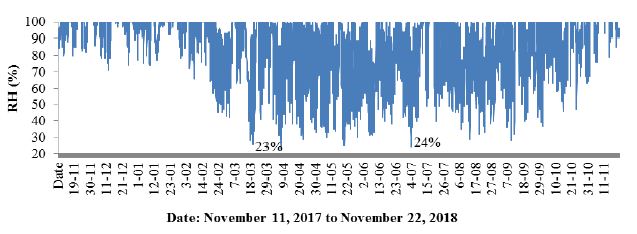
Figure 7: Changes in air humidity in an alder forest between November 11, 2017 to November 22, 2018.
A correlation coefficient was calculated for conductivity and temperature (Figure 8), which gave quite an interesting result.
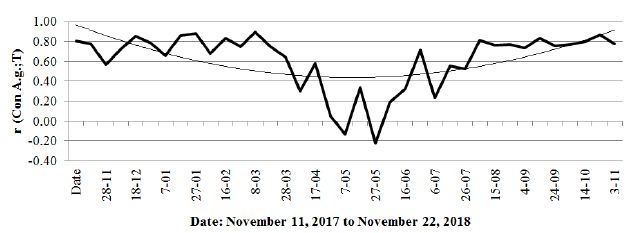
Figure 8: Correlation coefficient (r) between the conductivity of the black alder tree and the air temperature.
This coefficient gives high positive values in the autumn and winter period, when the temperature decrease correlates with a drop in the conductivity and in the summer period when the temperature rise is also related to the increase in conductivity. A comparison of the conductivity and groundwater table (Figure 5) indicates a strong relationship between the increase in conductivity in the summer and the sharp decrease in the groundwater level. The examined tree, as well as other alders in its surroundings, can be assumed to have strongly transpired, thereby causing a loss of water in the habitat. Notably, however, the decrease in the correlation coefficient to the negative values during the period of maximum humidity of the habitat occurred during very high (as for Polish conditions) temperatures. The root system at its full soil water capacity did not conduct enough water to supplement the deficiency associated with strong transpiration. Data are also provided by analysing the course of conductivity in short cycles (several days), which is shown by comparing the aforementioned alder and 2 hornbeams (Carpinus betulus) growing at a distance of 100 m from Alnus glutinosa (Figure 9).
The combination of these data clearly indicates a relationship of conductivity with a temperature drop, with the negative values of the conductivity values in both tree species approaching each other. Notably, on January 11, both species showed a marked decrease in conductivity at the same time, while the air temperature increased. Additionally, the conductivity value in the alder at that moment fell to below 50 Hz, which meant no conductivity was measured. Notably, the dormancy period for the tested trees began when temperatures fell below -5°C. The relationship between low air temperatures and conductivity is also thoroughly illustrated by Figures 11 and 12, which are a continuation of the changes in air and conductivity temperatures, as shown in Figures 9 and 10, respectively.
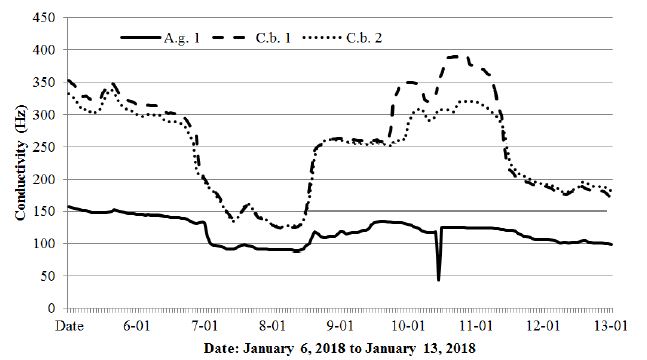
Figure 9: Changes in the conductivity of the alder (A.g.1) and two hornbeam trees (C.b. 1, C.b. 2) from January 6, 2018 to January 13, 2018.

Figure 10: Changes in air temperature in the alder forest and oak-hornbeam forest from January 6, 2018 to January 13, 2018.

Figure 11: Changes in conductivity of the alder (A.g.1) and two hornbeam trees (C.b. 1, C.b. 2) from March 1, 2018 to March 8, 2018.

Figure 12: Changes in air temperature in the alder forest and the oak-hornbeam forest from March 1, 2018 to March 8, 2018.
The period from March 1-8, 2018 shown in Figures 11 and 12 was chosen due to the extremely low temperatures (-16.3°C) recorded in the studied area with reference to the black alder and hornbeam. Admittedly, the temperature course shown in Figure 12 fluctuated strongly throughout the day, assuming higher values during the day and lower values at night, but the cumulative long period of low temperatures brought all the tested trees to dormancy. The spring awakening from this state took place on March 5, when the air temperatures exceeded values above 0°C for a long period. The fullness of spring, which in Poland usually falls in May, resulted in increased activity of the trees described above, simultaneously showing differences between species (hornbeam showed much higher conductivity), as well as individual differences within the same species (Figures 13).

Figure 13: Combined changes of conductivity and air temperature for the black alder (A.g.) and hornbeams (C.b. 1, C.b. 2) from May 8, 2018 to May 15, 2018.
Discussion
Many papers devoted to seeking the relationship between climatic factors and plant phenology have problematically researched single factors rather than their comprehensive and combined action [4,31–35]. A certain factor may, however, have a unique effect in different years, depending on the complex impacts of other factors. For example, Chuine & Courb [34] studied the effect of budburst summer temperatures on the growth timing. They finished their studies in one growing season, although the effects may be different in different years depending on the humidity of the given period. This phenomenon is indicated, among others, by Laube et al. [15], who concluded that air humidity influenced the onset dates, and suggested that air water uptake via aboveground tissue might be involved. The obtained results presented in this paper can confirm this theory. Undoubtedly, the conductivity measurement method in this study can be used in phenological studies, thereby combining in a more precise way the tree phenological stages with the combined impacts of air temperature, air humidity, and water resources available for plants and its transport in tree tissues. Preliminary results show that the life cycle phases of plants cannot be considered in the context of individual factors such as the chilling period, photoperiod, temperature, precipitation, humidity or light regime, but it is instead always a complex combination of factors with varying intensity depending on the season. However, the relationship between air temperature and water resources available for trees always plays a key role in these analyses, which results in correlating the daily and seasonal activity of trees with air temperature, atmospheric precipitation and air humidity. This study’s method provides such future research possibilities. The described anomaly recorded for sycamore and beech is likely a cumulative effect of several factors that are difficult to capture. The mechanism of this phenomenon may be similar to the formation of ocean rogue waves, as described by Birkholz et al. [36]. In this study, the authors stated that practical predictions likely appear unrealistic, despite the determinism in the system. However, the described phenomenon gives grounds for further research in this direction. In the context of research on phenology, the behaviour of trees in the dormancy period, as well as in research into the impact of climate change on trees, the data shown in Figures 11 and 12 are considered particularly valuable. Figure 11 shows how the alder and hornbeams awoke from the dormancy period on March 3, when the temperature rose sharply from -15.7 to 3.6°C, and when the winter period finally ended between March 4 and March 5, when the temperature was last recorded -7.5 (Figure 12). From that moment, all the trees that hitherto had no activity, entered the awakening phase, albeit with varying intensity. This phenomenon appears to be the first spectacular demonstration of the ending of the dormancy period.
Conclusion
The sensors used in this study underwent a three-year period of tests performed on 4 tree species (Acer pseudoplatanus, Alnus glutinosa, Carpinus betulus and Fagus sylvatica), thereby providing data that allow us to draw the following conclusions:
a) The study device passed the tests successfully at the air temperature range from -17.4°C to 33.7°C;
b) The system used to supply the device with energy allows for maintenance-free operation for up to 270 days in battery mode or for an unlimited period of time when the batteries are supported by a photovoltaic cell;
c) The device provides a data transfer via the GPRS network and tracks the results in the online mode;
d) Thanks to the conductivity measurement method, tracking the activity of the trees year-round is easy;
e) The sensors showed that the trees were active (although at a low level) during the winter; the real dormancy period was noted when the air temperature dropped below – 5.7;
f) The increase of tree conductivity is related to air temperature, but this relationship varies depending on the season and available water resources; in the spring season, the increase in air temperature increases the conductivity value, but in the summer heat period’s high temperatures lead to a decrease of conductivity;
g) For some temperature values, the conductivity is inhibited both in winter and in summer;
h) Differences in the conductivity between the examined tree species were also demonstrated;
i) An anomaly manifested by a simultaneous, rapid and short-lived increase in the conductivity of trees growing 220 km away from each other was also observed, although the reason for this phenomenon has not been explained yet;
j) The conducted experiment allows us to conclude that the applied method of conductivity measurements can be widely used in research related to phenology, physiology and tree ecology; it can also have a practical aspect through using measurements to determine the condition of trees.
Acknowledgment
We are grateful to Leśny Dwór and Międzychód Forest Divisions for the support.
Conflict of Interest
No potential conflict of interest was reported by the authors.
Author Contributions
PR and TW conceived the ideas and designed methodology. PR, TW and MK conducted field work and analysed the data. MK and PR wrote the manuscript.
Data Accessibility
The authors agree to deposit the data to a public repository.
References
- Gordo O, Sanz JJ (2010) Impact of climate change on plant phenology in Mediterranean ecosystems. Global Change Biology
- Vitasse Y, Lenz A, Körner C. (2014) The interaction between freezing tolerance and phenology in temperate deciduous trees. Frontiers in Plant Science.
- Denny EG, Gerst KL, Miller-Rushing AJ, Geraldine LT, Theresa M, et al. (2014) Standardized phenology monitoring methods to track plant and animal activity for science and resource management applications. International Journal of Biometeorology. 58: 591-601.
- Murray MB, Cannell MGR, Smith RI (1989) Date of budburst of 15 tree species in Britain following climatic warming. Journal of Applied Ecology 26: 693-700.
- Sogaard G, Johnsen O, Nilsen J, Junttila O (2008) Climatic control of bud burst in young seedlings of nine provenances of Norway spruce. Tree Physiology 28: 311-320. [crossref]
- Laube J, Sparks TH, Estrella N, Höfler J, Ankerst DP, et al. (2014) Chilling outweighs photoperiod in preventing precocious spring development. Global Change Biology 20: 170-182.
- Heide OM (1993) Daylength and thermal time responses of budburst during dormancy release in some northern deciduous trees. Physiologia Plantarum 88: 531-540. [crossref]
- Körner C, Basler D. (2010) Phenology under global warming. Science 327: 1461-1462.
- Caffarra A, Donnelly A (2011) The ecological significance of phenology in four different tree species: effects of light and temperature on bud burst. International Journal of Biometeorology 55: 711-721.
- Basler D, Körner C (2012) Photoperiod sensitivity of bud burst in 14 temperate forest tree species. Agricultural and Forest Meteorology 165: 73-81.
- Heide OM (2003) High autumn temperature delays spring bud burst in boreal trees, counterbalancing the effect of climatic warming. Tree Physiology 23: 931-936. [crossref]
- Jochner S, Höfler JBI, Göttlein A, Ankerst DP, Traidl-Hoffmann C, Menzel A (2013) Nutrient status: a missing factor in phenological and pollen research?. Journal of Experimental Botany 64: 2081-2092. [crossref]
- Penuelas J, Filella I, Comas P (2002) Changed plant and animal life cycles from 1952 to 2000 in the Mediterranean region. Global Change Biology 8: 531-544.
- Estiarte M, Puig G, Penuelas J (2011) Large delay in flowering in continental versus coastal populations of a Mediterranean shrub, Globularia alypum. International Journal of Biometeorology 55: 855-865.
- Laube J, Sparks TH, Estrella N, Menzel A (2014) Does humidity trigger tree phenology? Proposal for an air humidity based framework for bud development in spring. New Phytologist 202: 350-355.
- Linkosalo T, Lechowicz MJ (2006) Twilight far-red treatment advances leaf bud burst of silver birch (Betula pendula). Tree Physiology 26: 1249-1256. [crossref]
- Chuine I, Morin X, Bugmann H (2010) Warming, photoperiods, and tree phenology. Science 329: 277-278. [crossref]
- Samach A, Wigge PA (2005) Ambient temperature perception in plants. Current Opinion in Plant Biology 8: 483-486. [crossref]
- Penfield S (2008) Temperature perception and signal transduction in plants. New Phytologist 179: 615-628. [crossref]
- Menzel A, Fabian P (1999) Growing season extended in Europe. Nature
- Menzel A, Sparks TH, Estrella N, Elisabeth Koch, Anto Aasa, et al. (2006) European phenological response to climate change matches the warming pattern. Global Change Biology 12: 1969-1976.
- Ibáñez I, Primack RB, Miller-Rushing AJ, Elisabeth Koch, Anto aasa, et al. (2010) Forecasting phenology under global warming. Philosophical Transactions of the Royal Society 365: 3247-3260.
- Way DA (2011) Tree phenology responses to warming: spring forward, fall back?. Tree Physiology 31: 469-471.
- Nadler A, Raveh E, Yermiyahu U, Lado M, Nasser A, et al. (2008) Detecting Water Stress in Trees Using Stem Electrical Conductivity Measurements. Soil Science Society of America Journal 72: 1014-1024.
- Vandegehuchte MW (2013) Measuring sap flow and stem water content in trees: a critical analysis and development of a new heat pulse method (Sapflow+). PhD thesis, Ghent University, Belgium.
- Forster MA (2017) How Reliable Are Heat Pulse Velocity Methods for Estimating Tree Transpiration?. Forests 8.
- Kieliszewska-Rokicka B (1991) Physiology of growth and development (in Polish: Fizjologia wzrostu i rozwoju): Białobok S. (ed.) Nasze drzewa leśne, Lime-trees (in Polish: Lipy), Poznań, Arkadia. 15: 104-118.
- Wojtyla Ł, Adamiec M, Sobieszczuk-Nowicka E (2014) What do plants do in winter?. 1: 3-11.
- Sanders-DeMott R, Templer PA (2017) What about winter? Integrating the missing season into climate change experiments in seasonally snow covered ecosystems. Methods in Ecology and Evolution 8: 1183-1191.
- Machowski Summary of the storm season 2016.
- Hänninen H (1990) Modelling bud dormancy release in trees from cool and temperate regions. Acta Forestalia Fennica 213: 1-47.
- Hunter AF, Lechowicz MJ (1992) Predicting the timing of budburst in temperate trees. Journal of Applied Ecology 2: 597-604.
- Kramer K (1994) Selecting a model to predict the onset of growth of Fagus sylvatica. Journal of Applied Ecology 31: 172-181.
- Chuine I, Cour P (1999) Climatic determinants of budburst seasonality in four temperate-zone tree species. New Phytologist 143: 339-349.
- Kramer K, Ducousso A, Gömöry D, Hansen JK, Ionita L, et al. (2017) Chilling and forcing requirements for foliage bud burst of European beech (Fagus sylvatica L.) differ between provenances and are phenotypically plastic. Agricultural and Forest Meteorology 234: 172-181.
- Birkholz S, Brée C, Demircan A, Steinmeyer G (2015) Predictability of Rogue Events. Physical Review Letters.