Abstract
We introduce the emerging science of Mind Genomics to understand how ordinary people feel when they are presented with different vignettes about a couple’s behavior in tough economic times. Respondents each rated 24 unique vignettes describing the economic situation, the time of year, what the couple does in light of coping with the economic situation, and situation at home resulting from the coping efforts. The Mind Genomics method allows the respondent to predict what might happen to the couple. The approach introduces a projective approach to understanding social problems.
Introduction
During a discussion between authors Peer and Moskowitz, the issue arose as to whether there would be a better way to understand the feelings underlying family violence, especially between the adult couple. There are quite a number of papers and books devoted to the topic, so the contribution of this paper is methodological, rather than substantive[1-3].
The literature is filled with different reports about family violence co-varying with economically hard times [4], with the woman taking a job outside the home and the conflicts about the sizes of the salary [5-6], as well as issues such as external factors which would seem unrelated, such as the time of year [7-8] and even external cues such as football games on television [9]. The recent and ongoing Covid-19 epidemic, world-wide, and its seemingly never-end demand on family life is also now an excellent source for family discord, violence, and simply the normal reactions to a drawn-out social stressor.
For the most part, the literature of the family and family issues during time of difficulty approaches the data from the outside in, from observations of behaviors, and attempts to find general patterns. There is a rich world of knowledge from the ‘inside out’, from the point of view of the people in the family, but for the most part this knowledge is confidential, the outcome of private therapy sessions between therapist and family. The topics and issues can be discussed by the therapist in professional meetings and in written form for journals and the like, as long as the relevant identifying information is disguised to accord with privacy laws.
Advancing our understanding by using new tools to quantify, but go from the ‘inside out’
During the past four decades, researchers studying consumer behavior have been interested in questions which move beyond ‘what happened’ or ‘how does the consumer think,’ and into issues that might be called ‘what if thinking.’ The term ‘what if’ refers to the effort to create a model showing what the person might do under different situations. The value of ‘what if’ modeling is patently clear when the issue comes to identifying the decision rules of a person, especially when the objective is to sell the person a product or a service. The objective of all these research techniques is to ‘understand’ the problem [10].
The notion of a model of decision making can move beyond issues of economics, where one might naturally think of the usefulness of the model. What might happen when the modeling is used to create a structure to understand the alternatives possible in everyday behavior, behavior that does not involve a choice among alternatives, but simply a yes/no. For example, what might happen to our knowledge of social issues if we can understand what a person would do in various circumstances?.
In the past decade there has been a concerted effort to understand the mind of people who are presented with description of social situations, instructed to predict of what might happen, using a scale whose numbers are later analyzed to create mathematical models. The research ranges from studies of decision making in courtrooms[11], to studies of social distancing during the time of the Covid-19 epidemic [12], and on to issues involving corruption in the world of education [13]. The approach, Mind Genomics, described below, presents a new approach to understanding how people make decisions, doing so in a way which prevent the respondent from ‘gaming’ the study, giving the answer that the research is expected to hear.
How Mind Genomics works to understand the problem, yet prevent politically correct answers
This paper focuses on a limited topic of home behavior during a period of external economic stress. The approach uses the emerging science of Mind Genomics, a science whose origins can be traced to psychophysics (a branch of experimental psychology), to statistics (specifically experimental design and so-called functional measurement), and finally to consumer research (focus on common, everyday issues, expressed in specifics, rather than in general, and vague language).
Mind Genomics as a science began with the effort to understand how we react to ‘signals,’ or ‘messages’ in the environment. Typically, researchers focusing on the perception and understanding of the external stimuli would identify the test stimuli, and isolate the stimulus and the subject, so that the subject could focus on the stimulus. In this way the researcher could try to eliminate other factors, noise or random variability, which would confound the results. Occasionally, the researcher might wish to introduce distractions as part of the research task, in which case the experiment would be crafted to introduce both a known stimulus and known ‘noise,’ the aforementioned extraneous variability. This approach can be used both for qualitative research (e.g., anthropological research about shopping)[14], or for standard questionnaires.
Mind Genomics went a different direction, deliberating creating combinations of stimuli of known composition (mixtures of messages), presenting these to the respondent and getting an answer, such as a rating. The objective of Mind Genomics is to measure the intuitive response of the subject to the test stimuli, doing so in a noisy environment, but noise which can be factored out during the analysis. In that way, the Mind Genomics effort identifies the subject’s response to the test stimulus, understands the role of the distractor variables, and produces a quantitative measure of the subject’s response. At the same time, it becomes impossible for the subject to ‘game’ the system, viz., to provide so-called politically correct answers of the type that would be socially acceptable, even though misleading.
The Process of Mind Genomics applied to the projection of emotions onto a situation
The study here exemplifies the approach taken by Mind Genomics. In the interests of description, understanding, and discovery, we explain the approach with a case history, one dealing with expected responses in one’s home during a stressful situation. The study was developed from discussions with author Christine Peer. The process follows a set of choreographed steps which move on to a defined experiment generating data that can be immediately analyzed to reveal patterns. In the vernacular of science, one the effort can be defined as a ;cartography,’ to study a social situation, rather than an effort to prove or in contrast to falsify a hypothesis. Mind Genomics, viewed in this context, can be thought of as more ‘description’ of a situation, at least in the mind of a person presented with alternative ideas.
The Mind Genomics process proceeds in a systematic fashion, from the choice of topic and test materials to the creation the test stimuli (vignettes or combinations of messages), the evaluation of the test stimuli, the creation of ‘equations’ or ‘models’ showing how the test stimuli ‘drive’ the responses, and then the extraction of meaning and implications from the data. Over the past six years the process has been templated, allowing anyone to become a researcher (see www.bimileap.com). The templated system, doable even in a demonstration model, sets up the experiment, runs the experiment on the internet, acquires the necessary data, and automatically analyzes the results to generate results usually each to interpret. The statistics are standard ones (experimental design, regression analysis, clustering). The rapid, virtually automatically executed study allows the researcher, even a novice, to spend the valuable time interpreting data, generally data that most people find easy to understand. Patterns emerge clearly, as we will see from these data. With this emerging reality of rapid experimentation, the vision of a science of the mind, a science of the everyday experience, becomes feasible with low cost and little effort, available to all.
Step 1: Select a topic and create the raw materials. The topic sets the focus of the study. Typically, the topic constitutes a circumscribed set of experiences described in words. The topic could be described by a word, or a phrase, portraying a situation. For this study, we were inspired by the opening line of Tolstoy’s novel, Anna Karenina: Happy families are all alike; every unhappy family is unhappy in its own way”. Our topic was the ‘unhappy family.’
Following the choice of topic, create four questions which ‘tell a story.’ The questions are selected to move the ’story along’, but never appear in the test material (viz., the vignette described below). The hardest part of the Mind Genomics exercise often is the selection of the ‘appropriate’ questions because the questions will constitute the backbone of the vignettes, even though the questions never appear. As we see below, the four questions sketch out a reasonable, logical outline. Question B might have preceded Question A, but this decision was to follow the order below.
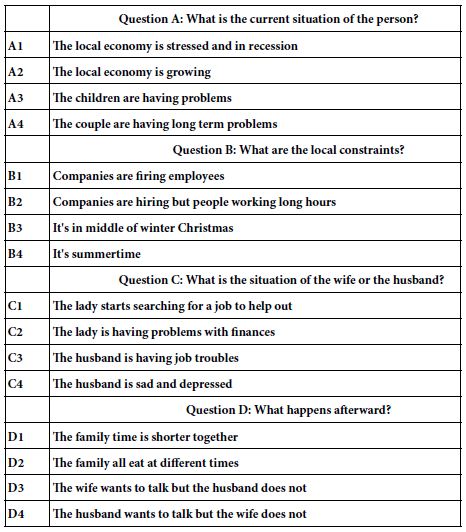
Question A: What is the current situation of the person?
Question B: What are the local constraints?
Question C: What is the situation of the wife or the husband?
Question D: What happens afterward?
The final part of the first step creates four answers to each question. The answers should be descriptive phrases which ‘tell a story,’ rather than simple yes/no terms which would not be found in a story. The objective is to create small stories, albeit stories without the necessary connectives. The stories or vignettes will comprise 2-4 phrases, presented in centered, stacked format, on a screen.
Table 1 shows the 16 answers, with the answer attached to one of the four questions. It is clear from Table 1 that each of the 16 elements is a simple description, with no hint of the emotional response of the members of the family to each other, although the element can describe the emotional condition of an individual with respect to the circumstances at large, such as elements C3 and C4 about the husband’s emotions in general. It is also clear that the elements paint short ‘word pictures’ and move beyond simply noticeably short and non-evocative phrases. The one element which is noticeably short is B4 (It’s summertime), which is meant to elicit the feelings about summertime.
At this point, it is important to note that the study appears to be simply notions, ideas thought up as convenience stimuli. That is true. The underlying objective of Mind Genomics is to make research easy, quick, iterative, and affordable. Unlike a great number of other research approaches, Mind Genomics encourages guessing about the correct test stimuli to use. Being able to iterate quickly, to pivot in an hour or two, means that the 16 answers or elements shown in Table 1, and indeed even the questions, can be tested in a study, the promising ideas kept and refined, the less than promising ideas discarded, and in their place new ideas introduced.
Table 1: The 16 elements (answers to the four questions)
2. Field execution. The field execution comprises a short, 3-4 minute ‘interview’ with a respondent. The respondent remains totally anonymous, both in terms of disclosure of identity by the panel provider (Luc.id), and by the researcher setting up the experiment. For both Luc.id and the Mind Genomics technology, BimiLeap®, the requirement is for everything to be anonymized, unless specifically requested by the researcher, and accepted by the respondent.
The online panel company, Luc.id, Inc., invites the respondents to participate. The respondents are compensated, but the details of the compensation are not relevant to the researcher. The respondents click on a link embedded in the invitation and are led first to a classification page, which thanks the respondents for participating, and which asks them to record their age, gender, and their marital status (question #3). This third classification question is in the purview of the researcher to write. For this study, the classification question was phrases as: What is your marital situation 1=single2=married3=living together4=divorced5=Not applicable
After the respondent completed the classification question, the respondent next read the orientation page, and rated 24 systematically varied vignettes, using the same rating scale. The BimiLeap program recorded the rating, the response time (time between appearance of the vignette on the screen and the rating), and then recorded the data in a database for almost-immediate analysis.
The respondents are introduced to the study by an orientation and a rating question. By design, the orientation is short. In this way, it is left to the specific elements to specify the situation. It will be the elements which will become the key to understanding the mind of the respondent. The less information in the orientation the more that the respondent will use the elements to drive the rating.
Here is a set of snapshots of families. Please read the full snapshot and tell us what will happen within the foreseeable future. Read the whole snapshot. Is it going to be peaceful, or do you sense some family violence brewing?
What will happen in the foreseeable future with this family?
1=peace and love …9=some violence(Bot=Peace, Top =Violence)
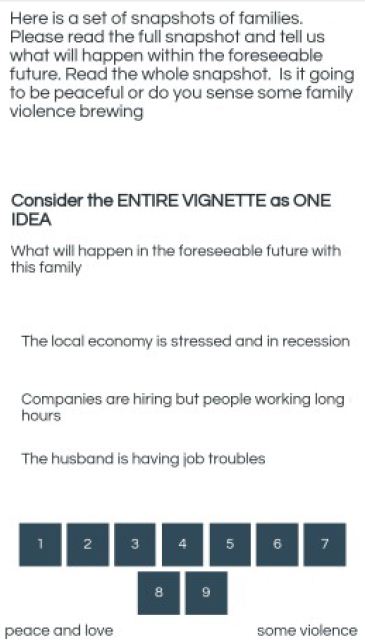
Figure 1: The appearance of a test vignette on the smartphone
Figure 1 shows an example of the vignette as it would appear on a smart phone. The format is set up to make it easy to scan the vignette, pick out the relevant material (an almost automatic behavior), and then rate the combination.
To the unaided eye, the vignettes appear to be haphazard combinations of elements, thrown together at random. The presentation of these types of combinations ‘frustrates’ the respondent who is trying to answer ‘correctly,’ viz., to ‘get it right.’The impression of a haphazard combination is very far from the reality, however, it is important to keep in mind that the 24 vignettes are created according to a strict plan which ensures that each element appears equally, that all elements are statistically independent of each other, and that the data for each respondent suffices to allow for a regression model to be created for that one respondent. The latter feature ensures the ability to estimate the necessary parameters (coefficients), allowing for clustering or segmentation according to the pattern of coefficients.
Each respondent evaluated a specific, and unique set of 24 vignettes, some vignettes comprising two elements (answers from two different questions), some comprising three elements (answers from three different questions), and the remaining comprising four elements (answers from all four questions). Each element appears five times across the 24 vignettes designed for an individual respondent. By unique is meant that the vignettes tested by one respondent were mathematically identical to the vignettes test by other respondents, but the actual combinations were different for each respondent. This approach allows the Mind Genomics effort to cover a great deal of the so-called ‘design space,’ the combinations that could be created. The approach, called the permuted design method[15], makes the Mind Genomics approach a good tool to learn, even when absolutely nothing is known about the topic. One need not know the most ‘promising region’ to test, something which frees the researcher from losing out when the initial guess is incorrect. Each experiment covers a lot of the design space, with as few as 20-30 respondents.
One final point is important to reiterate. This point is the strategy of experimentation which sacrifices precision of measurement (averaging out the variability), replacing it precision by identify the pattern, even though the individual points are variable. The analogy in medicine is the the MRI, magnetic resonance imaging. The pattern emerges from the many different combinations tested. With 50 respondents, for example, the study here covers 1200 combinations. The underlying strategy is to permute these combinations, keeping the mathematical structure the same, but changing the specific combinations [15]. With the 1200 combinations tested in this study (minus a few possible duplicates across respondents), and with measurement at each point, each combination, we have the opportunity to evaluate many different regions of the ‘design space,’ see what works, and then redo the study, focusing on that part of the space. We have the benefit of evaluating many different combinations, and not having to know anything at the start. A few iterations, and a researcher can ‘home in’ to promising areas, viz., topics driving violence.
A total of 50 respondents participated, all from the United States. New subgroups defined as the three mind-sets, will be discussed below. For now it is simply relevant to think of these mind-sets as individuals with different patterns of response to the vignettes.
3. Relating elements to responses. The Mind Genomics point of view is that the valuable information is in the parameters of the model relating the presence/absence of the 16 elements to the ratings. The first step to create the model defines two new dependent variables, both from the rating. Recall that the rating scale is anchored on both side, with 1 being a response of ‘love’ and a 9 being a response of ‘some violence.’ We are interested in the ability of the elements to drive love or violence, respectively. In order to address the issue of two opposite objectives, we create two new binary variables, Love and Violence, respectively. These two newly created binary variables make the interpretation much easier when we look at the tabulated results.
The actual transformation is:
Rating of 1-3 transformed to 100 (Love), ratings of 4-9 transformed to 0 (Not love)
Ratings 7-9 transformed to 100 (Violence), ratings of 1-6 transformed to 0 (Not violence)
To complete the transformation, a small random number (<10-4) is added to all of the transformed ratings, in order to add artificial but miniscule variation in the newly created binary variables, Love, Violence. The addition of this small random number ensures that the dependent variable will have some minimal level of variability, required for the OLS (ordinary least-squares regression)o work, and not to crash.
In the presentation of the results, we will presently only the positive coefficients, AND NOT REPORT coefficients which are either 0 or negative, respectively. The underlying themes emerge more clearly when we focus only on the positive coefficients. The negative coefficient simply means ‘absence of’.
4. Relating elements to responses – extending the analysis to individual level models to create new to the world mind-sets. One of the hallmark benefits of the Mind Genomics approach is its ability to uncover mind-sets, defined operationally as different patterns of coefficients for the same set of elements and the same rating attribute. We will create one group of mind-sets, defined a separate, non-overlapping groups of responses who show similar patterns of coefficients, both for Violence and for Love, respectively. That is, we have two types of behaviors, violence (ratings of 7-9) and love (ratings of 1-3). We will create a separate pair of models for each of the 50 respondents, one model or equation for violence vs the 16 elements, and the second for love vs the 16 elements. The independent variables for each respondent were set up by the aforementioned ‘permuted design’, producing a valid experimental design for each respondent. As a consequence, OLS regression allows us to create a valid pairs of equations or models for each respondent.
To create the individual-level equation, we fit a simple linear equation, without an additive constant, doing so for each respondent, once for the 16 elements vs the response ‘violence,’ and for the same 16 elements vs the response ‘love,’ respectively. The calculation generates 32 coefficients, 16 coefficients for the equation for violence, and a parallel 16 coefficients for the equation for love. There are no additive constants in either model.
The clustering which follows is a purely mathematical effort. There is no effort to interpret the data at the tie of clustering, although such an effort might be viable For Mind Genomics studies the clustering produces easy-to-label clusters called mind-sets, easy perhaps because the test stimuli on which the clustering is based, coefficients of elements, use cognitively rich stimuli.
5. Patterns emerging from models. Once the respondents have been identified according to the relevant criteria (total, age, gender, relationship status, membership in the mind-set from clustering) the relevant data for a group are analyzed twice, once creating an equation for Violence (ratings 7-9 converted to 100, otherwise converted to 0), and once creating an equation for Love (ratings 1-3 converted to 100, otherwise converted to 0). This time the equation does have an additive constant.
Binary Variable (Violence or Love) = k0 + k1(A1)+k2(A2)…k16(D4)
The additive constant is the expected proportion of the responses to be 100 (viz., rating 7-9) when there are no elements. The experimental design introduced above ensures that all vignettes comprised 2-4 elements, meaning that the additive constant is a purely estimated parameter.
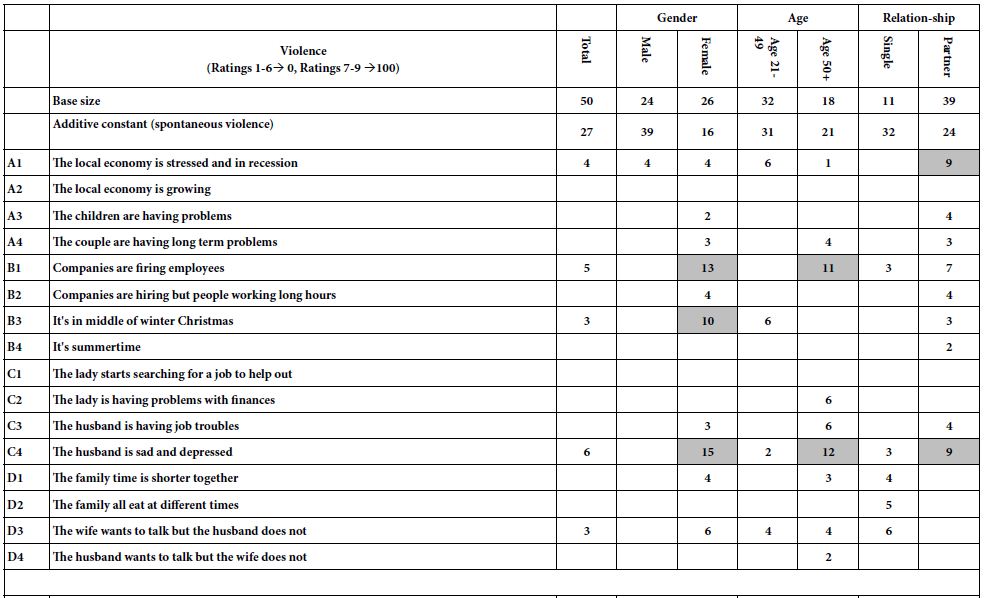
Patterns for ‘violence’: The additive constant can be interpreted as the expected percent of the responses the respondent will rate a vignette 7-9 in the absence of elements. Of course, that is not possible since by design all vignettes comprised 2-4 elements. Nonetheless, the additive constant is a valid measure, one that plays the role of a baseline feeling. The top of Table 2 shows the summary table for the response ‘violence’.
- The total panel is 27 – violence will be the outcome for one out of every four responses
- Males judge the outcome as violence far more frequently than do females(39 vs 16)
- Young people judge the outcome as violence more than do older people (31 vs 21)
- Single people judge the outcome as violence more than people with partners (married, in a relationship)
We now proceed to the individual elements, and the patterns emerging from the groups. As noted above, in the interest of clarity we do not present coefficients which are 0 or negative, but rather present only coefficients equal to or higher than 2. We also shade coefficients of +8 or higher, because it is around +8 that a coefficient reaches statistical significance (T value around 1.5 or higher).
Table 2 (Top; Violence) suggests no clear pattern by key subgroup, but some elements which drive expected violence, at least among some respondent groups. These trigger elements leading to expected violence are:
B1 – Companies are firing employees, as perceived by females and respondents aged 50+. This means that when these respondents read a vignette, the element B1 is likely to trigger the expectation of some violence occurring.
C4 – The husband is sad and depressed, as perceived by females, older, and those with current with partners.
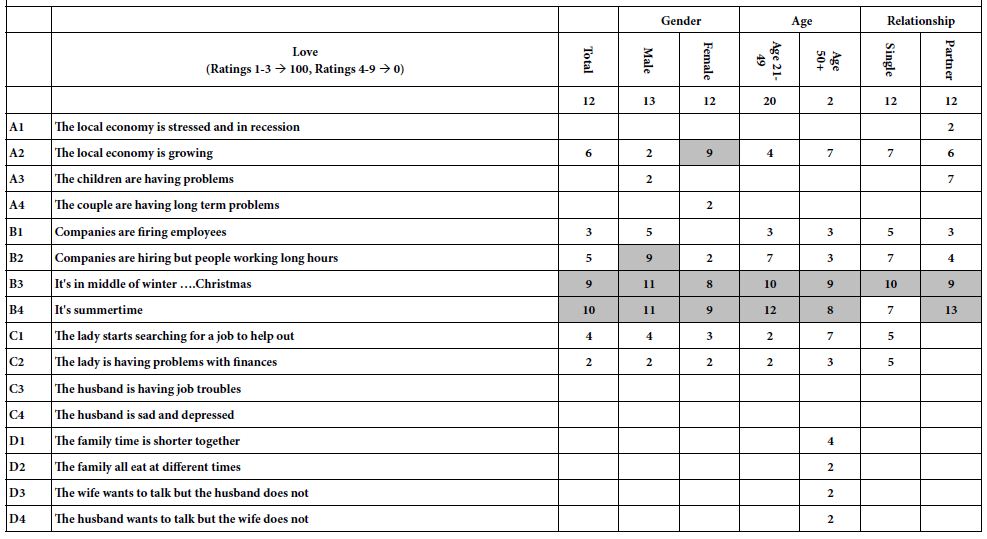
Patterns emerging for ‘love’: Table 2 (Bottom; Love) reveals very low additive constants, most around 12 or lower, except for the younger respondent (age21-49) showing a still-low additive constant of 20.
The two elements bringing almost universal love are descriptions of the season: (B3 – Middle of the winter Christmas) and B4 (It’s summertime)
We conclude from this first analysis that there are few strong differences among the groups. Only a few elements emerge to drive either violence or love.
Table 2: Models relating the presence/absence of the 16 elements to either violence or to love. The data come from the groups as they specified themselves in the up-front classification step.
6. How one element influences another (scenario analysis). The permuted experimental design brings with it an unexpected capability to uncover interactions among elements. The underlying experimental design is set up to make all the 16 elements statistically independent of each other. If every respondent simply evaluated the predesignated 16 combinations, it would be impossible to discover synergies between elements, where the presence of a pair of elements in the same vignette ‘turbocharges’ the rating, so the rating is much higher than one would predict from the simple sum of the coefficients.
The strategy for creating the scenarios follows a set of simple, based upon the notion that each of the elements in the study appears five times for every respondent, and is absent 19 for every respondent. Let us now select one of the four questions, for example question B. Question B comprises four elements presenting information about the time of year, and what companies are doing, respectively. We consider our four elements to be strata, and sort all of the vignettes into the four strata defined by the elements, as well as into the fifth stratum defined by all the vignettes which, by design, lack an element.
The previous exercise creates five strata. In each stratum, the element B is held constant, or does not appear. We now have five new data sets, each with elements from Questions A, C and D present. We simply run two sets of five equations, using as the dependent variables Top3 (Violence) and Bot3 (Love), respectively. The 12 independent variables are A1-A4, C1-C4, and D1-D4.
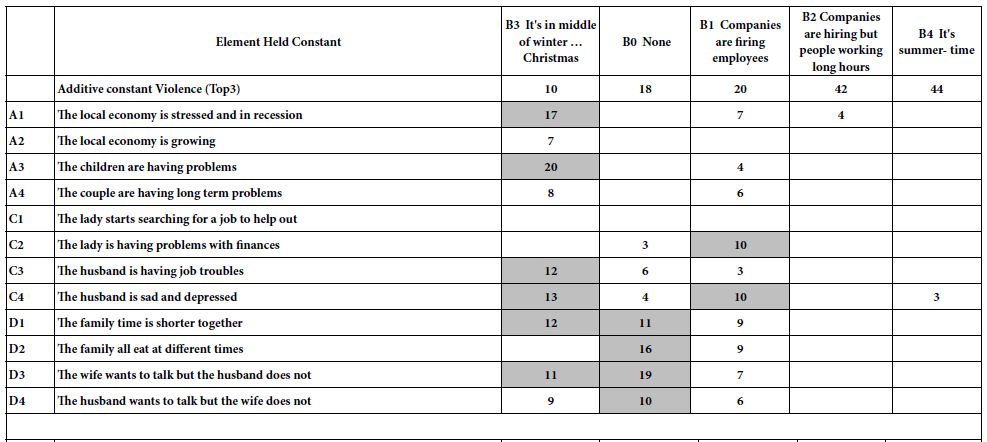
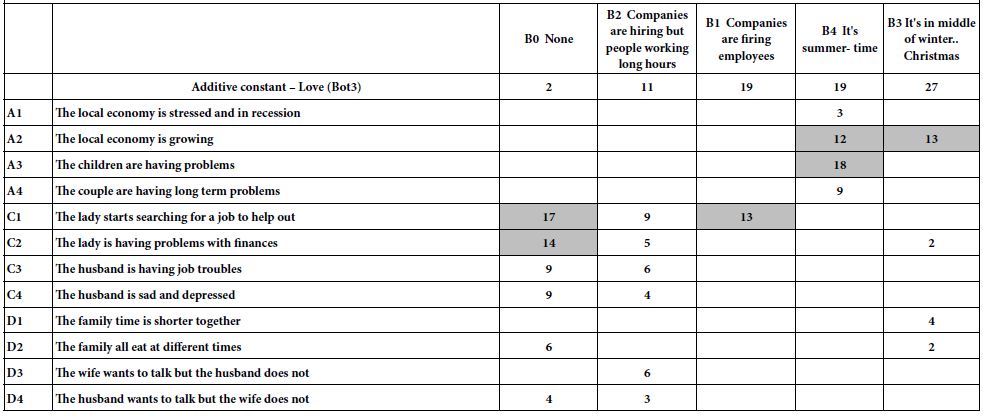
Table 3 show the five regression models. Each column corresponds to one of the five strata, defined by B1-B4, as well as B0 (B absent from the vignette). Each row corresponds to one of the 12 remaining elements. The top of Table 3 shows the coefficients for Top3 (violence), sorted by ascending order of additive constant. The bottom of Table 3 shows the coefficient of Bot3 (Love), sorted once again by ascending order of the additive constant.
Table 3 shows us much great performance of the elements as drivers of violence and love, respectively. Once the elements are constrained to be fixed in a vignette, they set the ‘stage’ for the ideas. We can see various new patterns emerge, allowing a deeper insight into the topic. For example, when we look at the model for B3 (it’s in the middle of winter Christmas), we see a low proclivity for violence (additive constant is 10, the lowest basic proclivity). ON the other hand, there are specific events which occur which substantially increase the likelihood of violence. Examples are A1 (The local economy is stressed and in recession), and A3 (the children are having problems).
Let us compare the violence expected in winter to the violence expected in summer. We now turn to the last column, for element B4 held constant. The additive constant is much large, an extraordinary 44.Yet, there are no other elements which drive expected violence.
We now move to the bottom of Table 3.We see that the same element, B3 (it’s in the middle of winter. Christmas) brings happiness, viz., synergizes with A2 (the local economy is growing).And, when it is summertime, rather than wintertime, element A3 (the children are having problems) bring love to the family, not violence. That is, the same element (A3)can drive violence (winter) or drive love (summer).
It is patterns like these which are the ‘value add’ to a Mind Genomics cartography. We are able to get a sense of new patterns, some of which make intuitive sense, and some which may spur an ‘aha’ moment.
Table 3: Scenario analyses, holding constant each of the four elements (and the no-element) from Question B, and estimating the model using the remaining 12 elements.
7. The allure of mind=sets as organizing principles. Our previous analyses of the data suggested some effects, such as love expected to emerge during two special times, Christmas in the winter and during summer, respectively. One can investigate the literature of the social and psychological sciences, and in doing so discover these disconnected nuggets which intuitively feel as if they are ‘weak signals’ emerging from a deeper, more coherent reality. The problem is that these signals emerge unexpectedly, and do not allow for a deeper investigation without first requiring a hypothesis of just ‘what is happening’.
Mind Genomics circumvents these problems, first by providing a method of clustering based upon a small, tightly defined topic, and then allowing the research to be done efficiently, inexpensively, and in a manner which moves stepwise through the problem in simple and illustrative steps. The clustering method is totally a theoretical, in terms of the meanings of the clusters. The clusters are labelled by which elements score highest and tell a ‘coherent’ story. The method of clustering is known as k-means clustering. The ‘distance’ between people in k-means clustering is known as ‘D’ defined as (1-Pearson R), where the Pearson R is the Pearson linear correlation between each pair of respondents, computed on the 32 coefficients [16].
The clustering performed on the data did not make any assumptions, because none needed to be made. The models were created for each respondent. The two decisions were to combine the models for one individual (violence and love together to extract people similar in both), and then to extract three mind-sets. Two, three, four, and even more mind-sets could have been extracted. The ideal is to work with as few mind-sets as possible (parsimony), but have each mind-set tell its own coherent story (interpretability). The data suggested that two mind-sets may have been the more parsimonious, but the patterns of the coefficients were not clear. Too much information seemed to cross the mind-sets, suggesting the need for a third mind-sets.
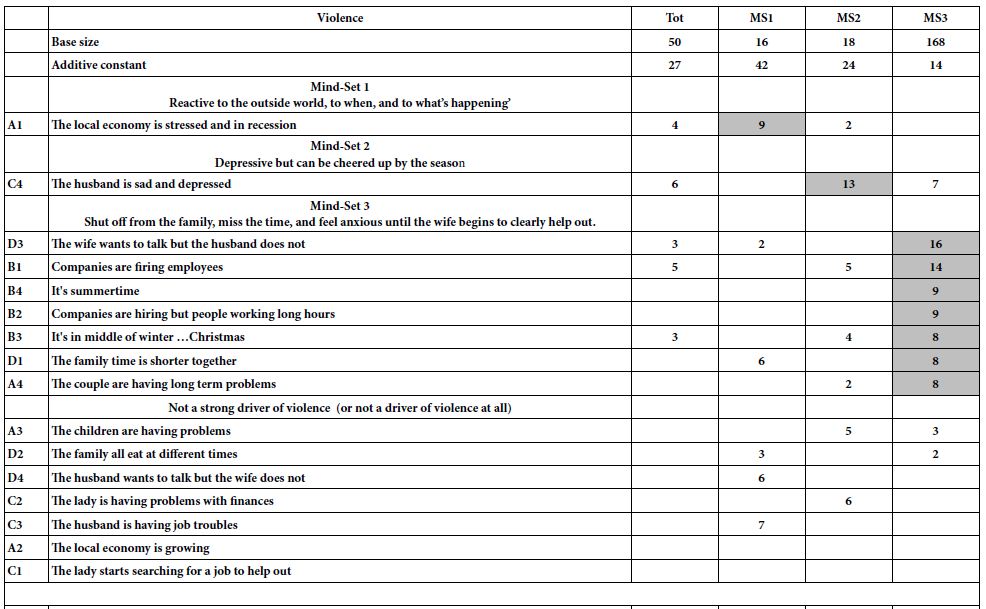
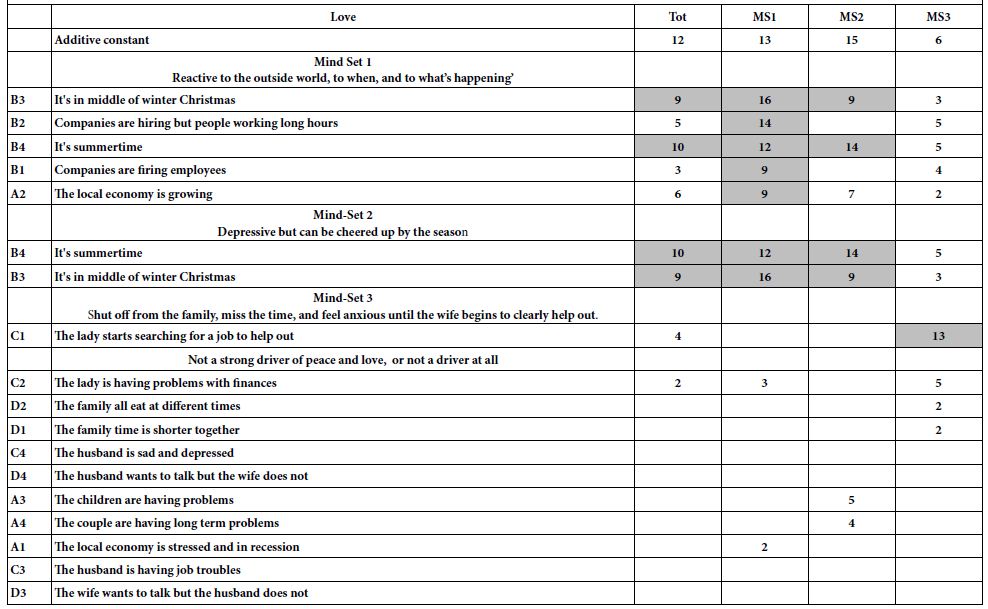
The results from the clustering to generate three mind-sets appear in Table 4 Again, we show only the additive constant, and the elements with positive coefficients for each mind-set. From these, we might name the mind-set. The Top of Table 3 shows the results for the response ‘violence’, the bottom of Table 3 shows the results for the response ‘love’. We will present the additive constant, and then piece together a story from the strong performing elements for that mind-sets.
Mind-Set 1 = High violence constant (42), very low love constant (12). Mind-Set 1 is prone to violence when the economy is stressed and in recession, but that is all. Mind-Set 1 is prone to love when things are better, when its summer and winter and when things are going well. Mind-Set 1 is also, however, just as prone to love when people are getting fired. Mind-Set 1 might be called ‘reactive to the outside world, to when, and to what’s happening’
Mind-Set 2 = lower violence constant (24) and very low love constant (15). Mind-Set 2 is probably a person who is ‘depressive but can be cheered up by the season.’
Mind-Set 3 = lowest violence constant (14), lowest love constant (6), strong reactor to the family situation. Mind-Set 3 is most likely to shut off from the family, miss the time, and feel anxious until the wife begins to clearly help out.
The important thing about Table 3 is that the elements which are strongest appear to paint a picture, which makes intuitive sense. Not everything ‘hangs together’ but we are dealing with a small sample of individuals, and the first effort, done in the period two days. The elements can be refined to expand the focus.
Table 4: Models relating the presence/absence of the 16 elements to either violence or to love. The data come from the three mind-sets which emerged from clustering. Only the positive coefficients are shown.
Discussion and conclusion
As we see from the cursory data from 50 respondents, the data provided by Mind Genomics is rich, indeed far richer than one might expect from a method emerging out of consumer research. One of the reasons for the rich information comes from the effort of Mind Genomics to provide a context for each stimulus. Rather than responding to a set of disconnected questions, the respondent evaluates a unique set of 24 vignettes, each of the vignettes more likely to tell a story than a single question would be.
In our study we take many pictures of the family and ask what might be happening for that particular picture or vignette. It is only later that we put together the individual snapshots (responses to the vignettes) into a coherent whole, an action made straightforward by the use of individual-level experimental designs, and permuted experimental designs. Mind Genomics capitalizes on both, identifying pictures from disparate combinations, and covering a lot of the ‘design space’ of possibilities, using the strategy of permuted experimental design.
The study reported here can be considered to be a cartography, an exploration of the ‘territory’ of the topic, rather than an attempt to confirm or falsify hypotheses. Mind Genomics gives us an opportunity to move in a variety directions, in the spirit of exploratory research, mapping the mind of people as they think about stressful situations, or even as they live through the stressful situation. The objective is not to accept or reject a hypothesis about ‘how behavior works’ or ‘how the mind works.’ Rather, the objective is to find repeating patterns of behavior, or stated patterns of thinking, either separate from the situation, or even in the middle of the situation. A good example of the approach can be found in [17], which deals with the types of behavior that teens want from doctors. That type of information is gathered in the same spirit as these data, namely understanding behavior in stressful situations.
The data lend themselves to the systemized creation of knowledge, literally at an industrial scale, across topics, countries, people, and external situations. For example, we might run this same experiment during several seasons of the year, and in several venues with varying economic conditions, as well as with people who are known to be prone to family violence versus people without that history. All of these approaches will end up creating, in rapid pace, an affordable database of the mind of family violence and family affection, a database that can be extended world-wide with very little effort. The patterns and the increased knowledge, and perhaps even many more ‘ah ha’ moments await the research. The approaches were laid down more than two decades ago, but the methodological advance is fresh, and the data continuing to pile up, in well-managed databases which maintain their value year after year because they reveal the nature of the ‘mind’ and ‘mind-sets’ confronted with situations inevitable emerging from the daily life of people world-wide[18-20].
References
- Ammerman RT, Hersen M (eds) 2000 Case studies in family violence. Springer Science & Business Media.
- Denzin NK (1984) Toward a phenomenology of domestic, family violence. American Journal of Sociology. 90 : 483-513.
- Momirov J, Duffy A (2011) Family violence: A Canadian introduction. James Lorimer & Company.
- Anderberg D, Rainer H, Wadsworth J, Wilson T (2016) Unemployment and domestic violence: Theory and evidence. The Economic Journal126 : 1947-1979.
- Aizer A (2010) The gender wage gap and domestic violence. American Economic Review100 : 1847-1859.
- Showalter K (2016) Women’s employment and domestic violence: A review of the literature. Aggression and Violent behavior31 : 37-47.
- Rotton, J., & Cohn, E. G. 2002. Climate, weather, and crime. In : RB Bechtel, A Churchman (Eds.), Handbook of Environmental Psychology. John Wiley & Sons, Inc. pg : 481-498.
- Shortlands ND. https://www.shortlands.co.uk/crisis-at-christmas/
- Card D, Dahl GB (2011) Family violence and football: The effect of unexpected emotional cues on violent behavior. The Quarterly Journal of Economics126 : 103-143.
- Moskowitz HR, Gofman A (2007) Selling Blue Elephants: How to Make Great Products that People Want Before They Even Know They Want Them. Pearson Education.
- Moskowitz, Howard, James Wren, Petraq Papajorgji (2020) Mind Genomics and the Law. 1st Edition. LAP LAMBERT Academic Publishing.
- Moskowitz H, Prendi V, Gere A, Harizi A, Papajorgji P (2021) Mind-sets of worried citizens and the ‘real-world experiment’ of Covid-19: A mind genomics cartography. Edelweiss Applied Science and Technology 41-49.
- Gere A, Papajorgji P, Moskowitz HR, Milutinovic V (2019) Using a Rule Developing Experimentation Approach to Study Social Problems: The Case of Corruption in Education. International Journal of Political Activism and Engagement6 : 23-48.
- Mariampolski H (2006) Ethnography for Marketers: A guide to Consumer Immersion. Sage.
- Gofman A, Moskowitz H (2010) Isomorphic permuted experimental designs and their application in conjoint analysis. Journal of sensory studies25 :127-145.
- Likas A, Vlassis N, Verbeek JJ (2003) The global k-means clustering algorithm. Pattern Recognition, 36 : 451-461.
- Gabay G, Moskowitz HR (2015) Mind Genomics: What Professional Conduct Enhances the Emotional Wellbeing of Teens at the Hospital?. Journal of Psychological Abnormalities.
- Moskowitz HR (2012) ‘Mind Genomics’: The experimental, inductive science of the ordinary, and its application to aspects of food and feeding. Physiology & behavior107 : 606-613.
- Moskowitz HR, Gofman A, Beckley, J. & Ashman, H., (2006) Founding a new science: Mind genomics. Journal of sensory studies21 : 266-307.
- Boserup B, McKenney M, Elkbuli A (2020) Alarming trends in US domestic violence during the COVID-19 pandemic. The American Journal of Emergency Medicine38 : 2753-2755.