Abstract
460 New York City based respondents participated in a Mind Genomics study to identify the messages which promote registering to vote. Each respondent evaluated 48 different vignettes, combinations of messages, created from a base of 36 messages. The vignettes for each respondent were unique, prescribed by an underlying permuted experimental design. The Mind Genomics design enables discoveries of mind-sets in the population (segmentation), and synergies among pairs of elements (scenario analysis). Data from the total panel revealed no strong performing elements driving intent to register to vote. Data emerging from three mind-sets revealed strong-performing elements for each mind-set. Scenario analysis, an analytic strategy which reveals synergies between elements. revealed the existence of far stronger messaging which could emerge by combining specific pairs of elements. The data and straightforward analytic process suggest that systematic exploration of issues in public policy can quickly create a repository of archival knowledge for the science of policy, as well as direct recommendations of actions to be taken. The speed of the approach furthermore allows the method to be even more powerful, as the iterations retain the strong performing elements, eliminate the weak performing elements, and replenish with new, hitherto untested messages.
Introduction
The case history we present grew out of a student competition to create more effective messaging regarding voting, specifically getting people to say that they intend to register to vote. Pollsters and other political professionals often have a sense of what is important to the voter, in terms of substantive topics, such as the economy, the looming issues with health care, and so forth. There is a plethora of possible messages from which to choose, with the problem being which specific topical message for which candidate. However, the important question on the table is, in the first place, how to get people to register to vote. For the more diffuse issue of ‘voting itself’, like the issue of ‘health maintenance itself,’ we deal with a more difficult problem. There is no pressing need, no issue to solve, no ‘pain points’ to address. Indeed, it is the exact opposite. There is an indifference to the democratic process, one that need not be explained nor studied, and whose origins are not relevant unless those origins can be marshalled to help identify an actionable solution. In other words, the general issue of ‘registering to vote’ is more difficult to understand [1]. There is no pressing fear on the part of the population. Rather, there is a creeping indifference, something which alarms a few people, but is irrelevant to many others until the consequences of such indifference destabilize the country or state or city, and the citizen’s pain begins [2]. The year-on-year decline in those who do not vote has been noted by a variety of sources [3,4]. The issues holding people back range from economics [5] to social alienation (Engler & Weisstanner, 2021), to inconvenience and forgetfulness in the wake of other commitments [6], all occurring in the advanced economies where there is freedom. The situation in the United States is interesting because at the same time that voting is deemed to an important civic duty, registering for voting entails passively registering to serve on a jury, an opportunity to do one’s duty, but not a popular one [7]. In other countries the change in voting over years emerges as a mixed set of patterns. There are a variety of countries where the voting is declining, and others where the voting is increasing. And then there are the dictatorship, where it is mandatory to vote, and of course to agree with the slate offered by the party. The increasing apathy of voters over the years has not gone unnoticed. In 2016, coauthor Markovitz, teaching a marketing class, used Mind Genomics to identify the messages that one could use, and the venues for those messages, both with the objective to increase voting. The idea way to find the different media used for each respondent, identify the strongest messages for the respondent (or group of respondents, called mind-sets), and then recommend the messages for each group, and the place to pick the messages. This dual strategy, optimize the message, and identify the right media, was done by the marketing class, and the results recommended [8].
The reanalysis presented looks more deeply at the nature of respondents, and the possible existence of synergies between elements.
- Stability of judgment across the array of evaluations: Are there respondents who change their minds during the course of the Mind Genomics evaluation? If so, how much do they change their mind? Are there those who increase their interest in voting with repeat evaluations, and if so, what messages appeal to them? And are there those whose interested decreases with repeat evaluation, and if so what messages appeal to them, but also what messages turn them off.
- Mind-Sets: Can we discover intrinsically different, structurally meaningful mind-sets of voters in the population of respondent? One of the foundations of Mind Genomics is its approach to uncover new-to-the-world mind-sets, different ways of making decisions about the same facts. Rather than differentiating voters on the basis of WHO they are, we focus on the way they weight information to make their decision, either YES – Register to vote, or NO – Do not register to vote, respectively.
- Interactions of messages: Can we identify synergisms between elements, so that with deep knowledge we can find those ‘nuggets’ of messages with the ability to break through the indifference?
Mind Genomics as a New Way to Accelerate Impossible-to-Game Measurement
Mind Genomics began in the world of experimental design, with the pioneering work of mathematical psychologists and statisticians R. Duncan Luce and John Tukey [9]. The objective was to create a new form of fundamental measurement. Their treatment is mathematical and filled with axioms. What is important to note is the word ‘conjoint’. The goal was to measure individual quantities by the behavior of mixtures of these quantities. In other words, to create variables, mix them, measure the reaction to the mixture, and then estimate the part-worth contribution of each element. Although conjoint measurement may seem a little too theoretical, the reality is that within a few years, consumer researchers at Wharton and other places (Green, Wind, etc.) would apply a version of Conjoint Measurement to features of services and products [10]. The engine of analysis would move from theoretical issues to practical applications in the world of marketing to focus on services and products. The early versions of conjoint measurement involved difficult-to-execute studies, where the respondent would compare two ‘bundles’ of ideas or offers and select one. The study required that the researcher know what to test ahead of time and know what to combine to get the best results, such knowledge coming from both experience with the topic. As a result, the early conjoint methods were cumbersome, requiring a significant knowledge of the topic with the study providing a little extra information.
There was a clear need to create a knowledge-development system, which could start at ‘ground zero’, with no knowledge, be easy to implement, be robust statistically, and be iterative. Thus was born the Mind Genomics approach, used here [11].
The foundations were simplified:
- Conceptualize the problem as a mix-and-match, rate, deconstruct, evaluate, discard, replace, move on. The steps were in part modeled after the classic books Plans and Structure of Behavior, by Miller, Galanter, and Pribram [12]. Their abbreviation for the process was TOTE, Test, Operate, Test, Exit
- The system should work with no starting knowledge and should NOT require much in the way of thinking by the researcher. All of the ‘hard’ work would be done in the template, the hard work being the up-front thinking of some ideas. The rest is mechanical [13,14].
- The process would become a discovery tool, open to inexpensive, rapid iteration, so that one would build up a great of knowledge at every iteration. The iterations should take no more than a few hours
- The data to be shown were collected by students, with little experience in the topic of voting or public polling, but who were able to create a powerful knowledge base in the matter of days.
Explicating the Mind Genomics Methods through a Case History
Step 1 – Create the Raw Materials
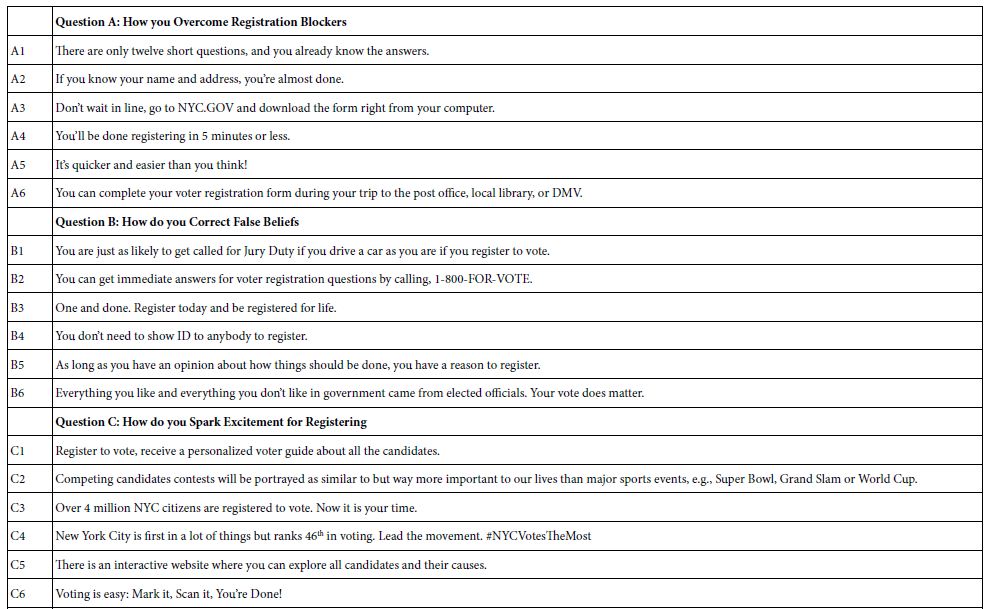
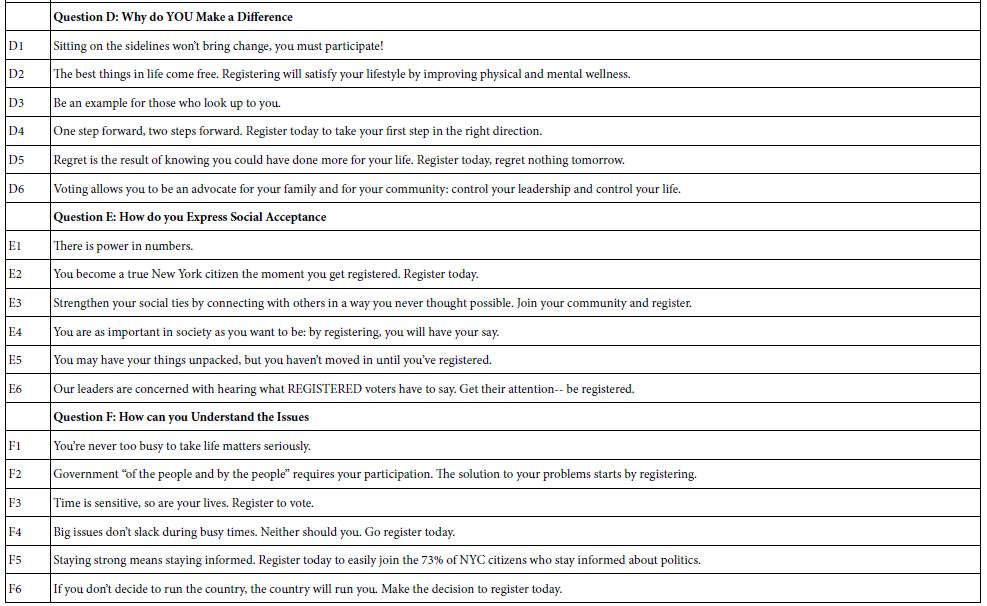
Mind Genomics works by presenting the respondent with specific combinations of messages, viz., so-called ‘elements.’ Step 1 creates these elements. The process begins by the selection of a topic (convincing people to register to vote). The process then proceeds by creating a set of questions which ‘tell a story’, and in turn a set of ‘answers’ or ‘elements’ for each question. In this study, we used a version of Mind Genomics set up for six questions, each question having six answers. The questions are not really questions, per se, but rather what one might call ‘topic sentences’ in writing and rhetoric. They move the account along. Ideally, they should fall into a logical order. Table 1 presents these six questions, and the six answers for each question.
In the Mind Genomics study, the questions are not shown to the respondents. As a result, the answers or elements must ‘stand on their own.’ During the evaluation, the respondent will find it easy to ‘graze’ through the different answers presented in the test combinations and make a judgment. The structure of the question, its clarity, is far less important than the structure of the answer, the element. Ideally, there should be no subordinate clauses, as few connectives as possible, and very little if-then thinking. In other words, simple declarative statements are best.
Table 1: The raw material for the Mind Genomics study, comprising six questions, and six answers (elements) to each question.
Step 2: Create Vignettes, the Stimuli to be Evaluated
One of the foundations of Mind Genomics is that the respondents should be required to evaluate vignettes, combinations of elements created according to an underlying experiment design [15]. The experimental design is a set of recipes, in this case 48 different recipes or vignettes for each respondent. Of these, 36 vignettes comprise four elements, with no question contributing more than one element. The remaining 12 vignettes comprise three vignettes, again with no question contribute more than one element. One of the differences between Mind Genomics and conventional research is the way that the underlying patterns are uncovered, viz., in terms of dealing with variability or ‘noise.’ The standard scientific approach is to suppress the noise by doing one element at a time so the respondent can focus on the element, or by testing the same vignette with many respondents, so that the variability can be averaged out. In both cases the research must perforce be limited to the 48 vignettes chosen, so it is good research practice to know a lot about the topic, so that the choice of the elements and the creation of the vignettes is ‘close to as good as it can be.’ The strategy seems adequate, unless of course one does not know much about the answer and does not even know where to start. In such a case, there is a reluctance to spend a lot of money on solid research. The Mind Genomics approach is quite different. The ingoing assumption is that the research should cover as wide a space of alternative combinations as possible, rather than be focused on a small, and presumably promising area. This strategy of covering a wide swath of the ‘design space,’ the world of possible combinations, is accomplished by a permutation strategy [15]. The basic mathematical structure of the experimental design is maintained, but the actual combinations differ. The happy consequence is that each respondent evaluates a different portion of the design space. That is, each respondent evaluates all elements, each element five times in different combinations, but it is the combinations which vary. Only at the end, when the ratings are deconstructed into the contribution of the individual elements do we get a consensus value for each element, the coefficient which is the key to the analysis, the ‘secret sauce’ in the parlance of business.
It is worth noting here that the systematic permutation and the potential for iteration means that the researcher really does not have to know, or even ‘guess’ what are the correct elements, and what are the combinations which will be most productive to reveal the answers to the problems. Rather, the underlying computer program for Mind Genomics will create the combinations for a respondent, present these combinations to the respondent, get the ratings, and store the data. The process is fast, the creation of the different sets of combinations is automatic, built into the system, allowing the entire process, from start to finish, from creating the elements to evaluating the analyzed results, to occur in a matter of hours, or a day at most.
Step 3 – Create the Additional Material for the Study
This material included the orientation page, comprising a short introduction to the topic, as well as a 9-point rating scale. As we see below, the orientation creates very little expectation on the part of the respondent about what the correct answer will be. It will be the task of the elements (Table 1), combined into vignettes (Step 2) which will drive the response. The orientation is simply a way to introduce the respondent to the task. The orientation for this study is simply the question ‘How likely are you to register to vote based on the information above?’. The respondent’s task was simple; read the vignette and rate the vignette. There was not deep information about the need for voting, etc. That information would be provided by the elements. The actual ‘look’ of the question appears below. Note that the vignette occupied the top of the screen, and the rating scale occupied a small section of the bottom of the screen:

In addition to the orientation and rating, the respondents were instructed to fill out a short questionnaire on who they were, and gave the researcher the permission to contact them, and to append additional third-party data of a non-confidential source. That additional information augmented the information obtained in the Mind Genomics experiments, allowing the researcher to understand the preferences and way of thinking of individuals based upon WHO they are, and WHAT they do. Such information is the typical type of information served up in studies. By itself the information informs but does not guide directly. Coupled with understand the important elements to drive a person to say she or he will register to vote, the information becomes far more valuable. One can then prescribe, rather than just describe.
Step 4 – Execute the Experiment
The respondents were from New York City participants who were members of a nation-wide panel company, Luc.id. Since around 2010 it has become increasingly obvious that it is virtually impossible to do online research, even with short interviews of more than 30 seconds without compensating the respondent. The days of massive responses to studies are finished, simply because people are both starved for time, and inundated with on-line surveys for every ‘trackable behavior’ of economic relevant. The refusal rate for interviews is skyrocketing. Thus, the use of online panel providers has dramatically increased, removing the onerous tasking of finding respondents for these short studies.
The study encompassed 460 respondents, with an interview lasting about 8-10 minutes. The compensated panelists generally do not ‘drop out’ of the study mid-way, as is the case for unpaid volunteers, where it is difficult to get panelists, and difficult to retain panelists to finish the task.
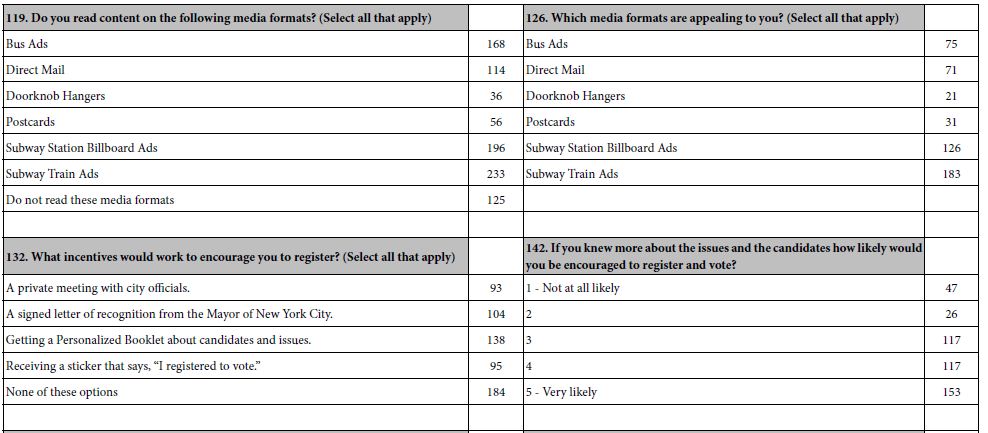
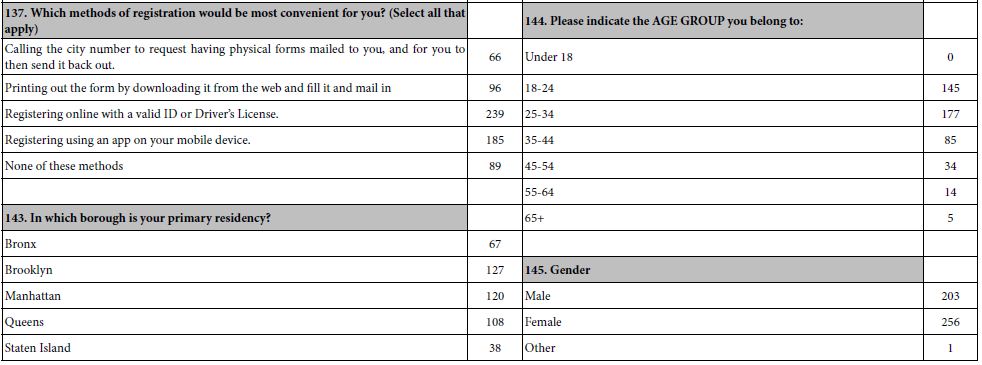
Table 2 gives a sense of the depth of information obtain about each respondent. Some of the questions were asked of the respondent at the time of the interview. Other questions were answered by third-party data purchased for the project.
Table 2: Example of some direct self-profiling classification questions and additional third-party data available and matched to the respondents by matching email addresses. A total of 145 additional data points were ‘matched’ to the study data of each of the 460 respondents.
Step 5: Create Models Which Relate the Presence/Absence of the Elements to the Rating
The respondent rated the vignettes on a 9-point scale. One might ordinarily wish to relate the presence/absence of the elements to the 9-point rating. The issue there is that we do not know, intuitively, what a 7 means, or what a 2 means, etc. We do know that the higher numbers mean that the respondent is more likely to register to vote, and that the lower numbers mean that the respondent is less likely to register to vote. That information is directional, but not sufficient.
In consumer and social research circles, there has been a movement to re-code scales such as the 1-9 or similar scales, to make the interpretation easier. We created six new binary scales, as follows:
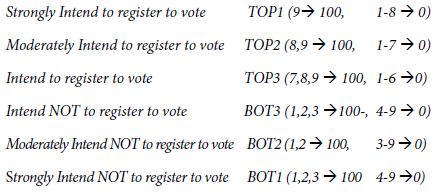
The statistical analysis OLS (ordinary least squares) regression needs some minimum amount of variation in the dependent variable. Across the entire set of 460 respondents, it is very likely that the respondents will not generate the same rating (e.g., TOP3, all respondents rating the 48 respondents 7-9). If the respondents were to somehow do so, the statistical analysis would crash. On the other hand, for individual respondents, it is likely that a respondent might confine all ratings to 1-3, making BOT3 always 100. IN that case, the OLS regression would crash when creating a model or equation for that one respondent, bringing the entire processing to a halt.
To forestall the problem of a ‘crash; we add a vanishingly small number to each of the binary transformed variables that we just create ensuring that the actual transformed ratings vary a very little but do vary around the levels of 0 and 100, respectively. There is no meaningful effect on the regression coefficients emerging after performing this small prophylactic adjustment, but we prevent crashes. Indeed, without this adjustment, about 5% of the respondent models ‘crash’ because the respondent’s transformed numbers either all map to 100 or all map to 0.
The experimental design at the level of both the individual and at the level of the group allows us to create equations relating the presence absence of the elements to the transformed, binary ratings. We create six equations, each expressed as:
Binary Rating = k0 + k1(A1) + k2(A2) … k35(F5) + k36(F6)
Each equation is characterized by its own additive constant, and its own array of 36 coefficients. We interpret the additive constant as the expected percent of the respondents who will register to vote or not register to vote (according to the variable definition), albeit in the absence of elements. The additive constant is a purely estimated parameter but can be used as an index for predilection to register to vote. We expect increasing magnitudes of the additive constant as we go from TOP1 (Definitely intend to register to vote) to TOP3 (Intend to register to vote), and we expect a decreasing magnitude of the additive constant as we go from BOT3 (intend not to register to vote) to BOT1 (definitely not intend to register to vote). For the first analysis, we create six equations or models, based on the data from the total panel, and using each of the newly created binary variables as a dependent variable. With 36 elements, and six dependent variables, the OLS regression generates a massive amount of data (six additive constants, 216 coefficients, viz., 36 coefficients for each of the binary variables). That amount of information overwhelms the researcher, disguising patterns where they exist. To uncover the pattern, we blanked out all coefficients of 3 or lower, only to end with no strong performing elements. For the Total Panel only, we looked at elements with coefficients of +2 or higher. For all other analyses of coefficients, we look at elements with coefficients of +3 or higher. We begin first with the additive constant, the estimated propensity to register to vote, in the absence of elements. As we expected looking for individuals who feel strongly about voting generates a low additive constant of 10 (viz., for TOP1). We are likely to find only about 10% of the responses to be a ‘9’, in the absence of elements. When we make the criterion easier, accepting a 7, 8, or 9, (viz., TOP3) the additive constant jumps to 27.
Table 3 shows us that despite our efforts to find motivating elements, only six elements passed the relatively easy screen, viz., a coefficient of +2. The coefficient of +2 is very low in the world of Mind Genomics. Table 3 shows that the effort to find drivers of voting produced only three elements which show any promise, using the data from the total panel, and the promise they show is less than enthusiastic.
A4 You’ll be done registering in 5 minutes or less.
B2 You can get immediate answers for voter registration questions by calling, 1-800-FOR-VOTE.
D6 Voting allows you to be an advocate for your family and for your community: control your leadership and control your life.
When we move to the response ‘Not Register to Vote’ we see a similar pattern. The additive constants are similar in magnitude and go in the right direction. The strong statement about not voting, a rating of 1, captured by the variable BOT1, suggest that 10%, saying they would not definitely register to vote when the criteria are made less strict.
These are the three elements, presumed at the start of the experiment to drive positive voting, but instead drive the opposite, not registering to vote:
D3 Be an example for those who look up to you.
E5 You may have your things unpacked, but you haven’t moved in until you’ve registered.
F2 Government “of the people and by the people” requires your participation. The solution to your problems starts by registering.
Table 3: “Strong’ performing elements from the total panel, defined operationally as a coefficient of at least +2. Only those coefficients are shown. Missing elements failed to generate any coefficients of 2.0 or higher for any of the binary dependent variables.

Do People Change Their Stated Likelihood of Voting During the Interview?
Having now looked at the data from the total panel, and finding very little, we must pursue the reason why we fail to discover strong elements from the total panel. If we did not have the underlying structure, we would not know how weak the data are from the total panel. We would simply choose the strongest performing vignette and work with that vignette. Such an approach characterizes the research where the stimuli are put together, without structure. If we have one or two or even three or four elements varying, we might make a good guess, but we could not be sure. Mind Genomics take us in a different direction, to uncover the performance of the elements. It is those elements which constitute the building blocks of revised potentially better performing elements. Our first analysis looks at the (possible) change in the rating assigned by the respondents as the interview or experiment progresses. Recall that each respondent evaluated 48 unique vignettes, each vignette comprising 36 combinations of four elements (one from each of four questions), and 12 combinations or vignettes of three elements (one from each of three questions). By design, and by the systematic permutation of the vignettes, respondents saw different vignettes. We cannot measure change in the response to a specified vignette which most likely appeared just a few times, but we can measure the relation (if any) between the average rating assigned by the respondent and the order in the study (rating 1-9 for each vignette, order 1-48).
Our analysis uses OLS regression, done at the level of the individual respondent. For each respondent we know what was assigned to each vignette rated by the respondent, as well as the order of testing. We express the relation as: Rating (9-point scale) = k0 + k1(Order of Testing). The slope, k1, tells us the effect of repeating the interview. We are interested in the sign of the slope, k1, and then the magnitude of the slope. When k1 is positive we conclude that the respondent becomes more interested in registering to vote as the interview or experiment goes on. It may be linked to the respondent being more sensitive to messaging. When k1 is negative we conclude that the respondent becomes less interested in registering to vote as the interview or the experiment on. The respondent may be turned off. In turn, the magnitude of the slope, viz. the numerical value of k1, tells us how many rating points on a 9-point scale will be added to the rating or subtracted from the rating for each additional vignette evaluated. Figure 1 shows the estimated magnitude of change in the rating assigned by a respondent across the 48 vignettes. Most of the respondents show a small change in the rating from vignette #1 to vignette #48. Most the respondents are within +/- two points on the 9-point rating scale. Keep in mind that the regression analysis generating the data was did not look at the actual range, but simply the pattern of changes manifesting itself at the individual respondent level.

Figure 1: The distribution of expected ranges to be expected as the respondent proceeds to evaluate 48 vignettes. Most of the range lies between an increase of 2 points to a decrease of 2 points from first vignette to last vignette.
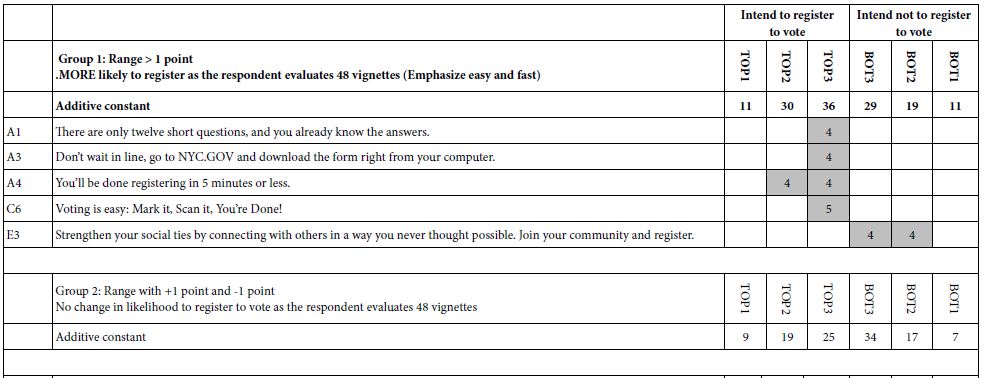
Thus far we know the behavior of the respondent and can differentiate those respondents who are likely to increase versus decrease their ratings. We do not know anything about their criterion for making their judgments. We could ask the respondents to tell us their criteria, but it’s unlikely that they could tell us. The interview is so short, the vignettes judged so quickly, and the attention to the topic only modest while the interview is going on. Despite what might be wished for by novice researchers, most experienced researchers in these types of studies KNOW that their respondents are barely interested in the topic and are answering automatically to stimuli which much seem to them like a ‘blooming, buzzing confusion’. Those are the words of Harvard psychologist William James, when describing how a baby must perceive the world. Fortunately, Step 2 above tells us that despite the response of the respondent (or professional) asked to describe the test stimuli, there is a strongly laid structure underlying each respondent’s set of 48 vignettes. The structure prescribes exactly which elements belong in each vignette, doing so down to the level of a single respondent. We divide the respondents into three groups, defined qualitatively as those with positive range (one point or greater increase in the rating from vignette #1 to vignette #48), those with a flat range (between -1 and +1 point across 48 vignettes), and those with negative range (one point or greater decrease in the rating across 48 vignettes). The first become more interested in registering to vote, the second don’t really change their rating, and the get turned off.
Table 4 shows the strong performing elements for each group. Again, we select only those elements which have a breakthrough coefficient, now defined as +4, but which could easily be changed. The objective is to reduce the ‘wall of numbers’ to a limited set with the patterns coming through.
We see the following patterns emerging:
- There are breakthrough elements for Groups 1 (positive range) and Group 3 (negative range), but no strong elements for Group 2 (flat range)
- Despite the differences between the groups, and the differences in the patterns of the additive constants, there is no clear ‘story’ about what is driving Group1 (positive range) vs. Group 3 (negative range).
Table 4: Strong performing elements for three groups created on the basis of the range of the 9-point rating to be observed as the respondents proceeds to rate vignette 1 to vignette 48.
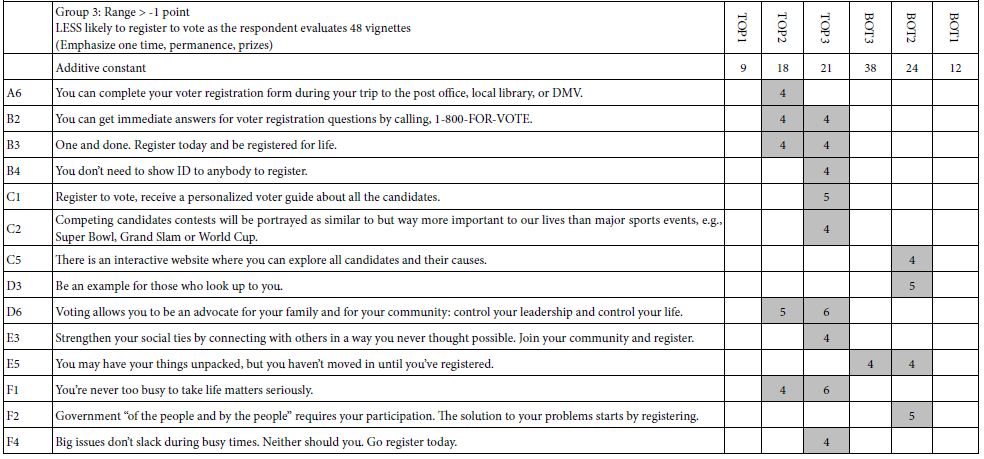
We conclude that if there is a story, it is deeper than the observed patterns of responses. Looking at large morphological differences in the patterns of responses gives us a lot of data, a lot of comparisons, but sadly no insight.
Uncovering Underlying Mind-sets based on the Pattern of Coefficients
One of the hallmark features of Mind Genomics is its focus on the decision-making of the everyday, and the recognition that the variability often observed in the data may be result in part from the combination of underlying groups with different criteria. A good metaphor is white light without color. One who looks at white light would say that it is colorless, but the structure of white is that emerges from three primary colors, red, blue, and yellow, respectively. Continuing the metaphor, what if the lack of strong, interpretable patterns in the data come not so much from lack of patterns, nor from intractable variability, but rather from the class of different mind-sets, having different criteria. The failure to uncover strong patterns may be the result of mutual cancellation. Mind Genomics researchers have worked out simple ways to identify these mutually exclusive primary groups, without the benefit of ‘theory’ about how the topic actually works, but simply on the basis of ‘hands-off’, clustering. Recall that each respondent evaluated a unique set of 48 vignettes, embodying the 36 elements in different combinations, with the data from each respondent constituting a complete experimental design. That is, each respondent both evaluated different combinations, but the mathematics of each set of combinations allows us to create a model for that individual [15].
To create these primary groups, or ‘mind-sets’, we followed these steps, adapting the Mind Genomics process, but incorporating two dependent variables simultaneously, register to vote (TOP2), and not register to vote (BOT2).
- Create the mind-sets on the basis both of drivers of registering to vote, and drivers of NOT registering to vote. That is, we were interested in moving beyond one direction (drivers of registering to vote)
- For each of the 460 respondents, create a model for TOP2 relating the presence/absence of the 36 elements to the TOP2 value. Create another model for BOT2. We thus have 460 pairs of coefficients, each pair comprising 36 coefficients.
- When estimating the model for each respondent, do not use the additive constant. The rationale is that we will be combining the two sets of 36 coefficients to create a set of 72 coefficients for each respondent. All the information must be available solely in the coefficients. The technical appendix shows that estimating the coefficients without an additive constant produces the same pattern of coefficients as estimating the coefficients with an additive constant. The only difference is the magnitude of the coefficient. Figure 2 in the Technical Appendix shows the high co-variation between the two sets of coefficients, estimated for the same data, one without and one with the additive constant, respectively.
- Create the 460 rows of data, comprising 36 coefficients for TOP2, and 36 coefficients for BOT2. Each respondent now has 72 coefficients.
- Use principal components factor analysis to reduce the size of the matrix, by extracting all factors with eigenvalues of 1 or higher. This produced 19 factors.
- Rotate the factors by a simplifying method, Quartimax, to produce a set of 19 new factors, rather than 72. Each respondent becomes a set of 19 numbers, the factor scores in the structure, rathe than a set of 72 numbers. We van be sure that the 19 factors are independent of each other.
- Extract two and three clusters, or mind-sets, based on strictly numerical criteria [16]. The cluster method is the k means clustering, with the measure of distance between any two people defined by (1-Pearson Correlation between the two people on the 19 factors). In practical terms, any clustering method will do the job, since the clustering is simply a heuristic to divide the 460 respondents into similar-behaving groups
- The principal component factor analysis allows us to create models for two segments (mind-sets) corresponding to the two-cluster solution, and three segments (mind-sets) corresponding to the three-cluster solution. The three-cluster solution was clearer. One could extract ore clusters, or mind-sets, but we opted for parsimony.
Create the six equations, with additive constants, for each of the three mind-sets, using the respondents allocated to the mind-sets. Eliminate all elements which fail to exhibit a coefficient of +4 in any model. This step winnows out most of the elements. The elements which remain show strong performance, and also suggest an interpretation, something not seen the previous data because variables did not have ‘cognitive richness’.
Table 5 suggests that there are three subtly different groups
MS 1 – A sense of voting is easy, fun, like sports. Don’t want to be reminded of the ‘seriousness’ of voting
MS 2 – Make it easy, make it simple, learn. They are ready. Nothing really turns them off.
MS 3 – Hates lines, make it easy. That’s all. Avoid talking about social responsibility. It’s a turnoff
The additive constants suggest that Mind-Set 1 (voting as fun) is most likely to register, without messages
Mind-Set 2 is likely to register. Nothing really turns them off.
Mind-Set 3 can be swayed by the right or wrong messages
The three mind-sets differ both in the pattern of likelihood to register and in the topics which turn them off, if there are any. Only Mind-Set 3 really responds in a way that suggest they are turned off.
Table 5: Strong performing elements for three emergent mind-sets (coefficient > = 4).
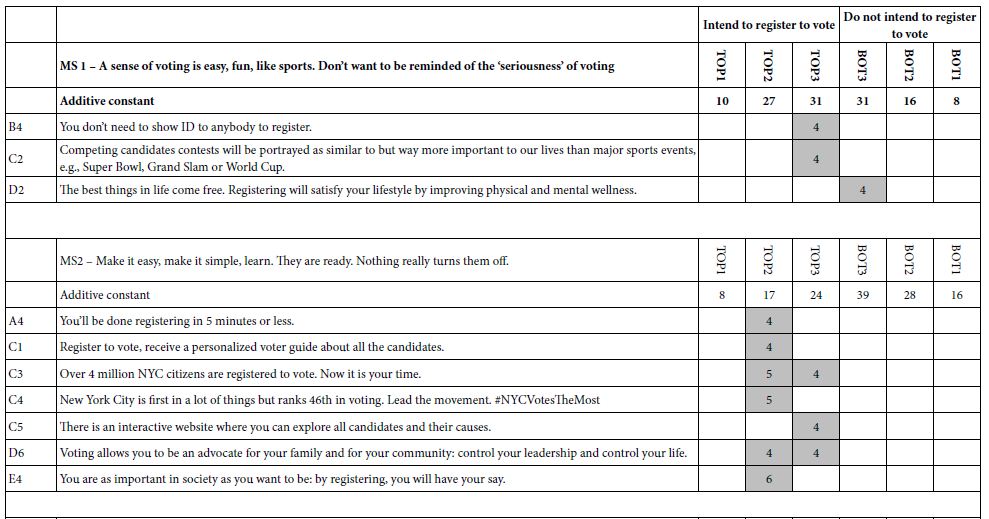

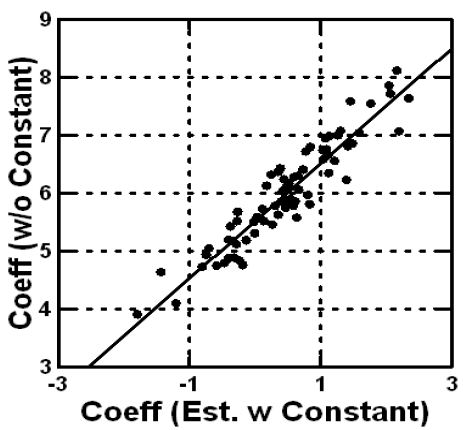
Figure 2: Scatterplot based on the data from the total panel, showing the strong co-variation of the 36 coefficients when estimated with an equation with an additive constant, vs. absent an additive constant.
Synergisms in Messages – Increasing the Likelihood of Mind Set 1 to Say They Will Register to Vote
As noted above, most conjoint measure studies with experimental design focus on a limited set of combinations, with the respondent testing all or only some of the combinations. None of the methods use permuted designs. It is the permuted design which allows the research to explore a great deal of the design space. One of the unexpected benefits is the ability to identify synergism and suppressions between pairs of elements. It to the study of interactions, and the search for synergism that we now turn.
Moskowitz and Gofman [11] introduced the notion of ‘scenario analyses for Mind Genomics. The guiding notion is that pairs of elements may synergize with each other, but the synergy could be washed out in a larger design. A better way to find out whether elements synergize is to select one of the questions (e.g., F), and separate all the data in the study into one of seven different strata, specifically all those vignettes where there is no F (by design), all those vignettes where F is held constant at F1, all those vignettes where F is held constant as F2, etc. Our starting data, therefore, is a set of several strata. We will end up running seven equations of the same type, one equation for each stratum. The equation will have only 30 independent variables (A1-E6), because for each stratus there is a single value of F, a single element. The set of elements from F are no longer independent variables. They simply exist in the vignette, or in the case of F0 deliberately left out of the vignettes. We can now select a target population, e.g., Mind Set 1, and run the regression seven times, once for each stratum. We will choose the most stringent dependent variable, TOP1 (definitely register to vote). The independent variables will be A1-E6, 30 out of the 36 variables. The additive constant is still the expected percent of response TOP1 (rating of 9, definitely register to vote), in the absence of the elements. The coefficients are the incremental percent of responses ‘will register to vote’ when the element appears in the vignette. Armed with that information let us now run the reduced model on each of the seven strata. Table 6 shows the coefficients. The columns correspond to the seven different strata. The rows correspond to the elements which show coefficients of at least +10 in one stratum. These are elements which are expected to synergize. To make navigating easier, and to uncover the strong performing combination, we present only those cells with positive coefficients of +4 or higher. The simplest way to discover combinations is to search for the shaded cells with the highest coefficient and add that high coefficient to the additive constant. The result will be the estimated score for that pair of elements as the key message. There are several very strong combination, combinations that we would not have guessed, first in the absence of mind-set segmentation, and second, in the absence of ability to uncover synergistic (or suppressive) combinations. A good example is the synergistic pair (F4, B6), and then ‘finished off’ with element D5. Table 6 suggests that the total score for TOP1 (definitely would register to vote) would be 11 for the additive constant, 15 for the synergistic pair (F4, B6, or 26 points. There is room for one more element, which we are free to choose, as long as the element makes intuitive sense and fits with F4 and B6. One example could be D5:
F4 = Big issues don’t slack during busy times. Neither should you. Go register today.
B6 = Everything you like and everything you don’t like in government came from elected officials. Your vote does matter.
D5 = Regret is the result of knowing you could have done more for your life. Register today, regret nothing tomorrow.
A possibly better strategy emerges when we look at F2 as an introductory phrase. The element itself does not bode well (additive constant of -1), but it synergizes with four of the six elements show in the stub (row) of Table 6.
F2 Government “of the people and by the people” requires your participation. The solution to your problems starts by registering.
B2 You can get immediate answers for voter registration questions by calling, 1-800-FOR-VOTE.
C4 New York City is first in a lot of things but ranks 46th in voting. Lead the movement. #NYCVotesTheMost
D2The best things in life come free. Registering will satisfy your lifestyle by improving physical and mental wellness.
E4 The best things in life come free. Registering will satisfy your lifestyle by improving physical and mental wellness.
Table 6: Strong pairwise- interactions between elements F1-F6, and the remaining elements. The data come from respondents in Mind-Set 1.

Discussion and Conclusions
The world of public policy requires that the citizens perform their duties. Some of these duties are mandatory, such as military service, education, and obeying the law. Some are rights, not necessarily duties, such as registering to vote. Ask any group of people about how they feel about registering to vote, and you are likely to get a range of answers, from affirmation of patriotism, to indifference, to the absolute dislike of registering to vote because it is at once disinteresting, a duty, and worst of all, it puts one on the list for jury duty, another public service not in great favor. The sentiments around registering to vote are often simply measured as ‘yes/no’, e.g., will you register to vote or not register to vote. In this Mind Genomics study (really experiment), we have gone into the topic as it were a product or service, being offered to the respondent. We have used the language often used to ‘convince,’ only to discover that across the entire panel respondents, there are really no strong messages. If voting were a service or a product, we would ‘go back to the drawing board’ and try again
The speed, simplicity, cost, and templated structure of Mind Genomics, especially with smaller versions of the study presented here, 16 rather than 36 elements, makes it now possible to iterate through, testing different messages of a ‘public service’ nature. Public service messages may be viewed as a necessary evil, to be checked off, even though they contain little of a sales nature, and are primarily exhortations to do one’s duty and to be good citizens. Or, as Mind Genomics suggest, public service messages may provide the necessary matrix of ideas to use as a way to understand and to motivate the citizen. The study run here itself constitutes a larger-than-usual study in terms of the ideas explored. The results suggest a lack of knowledge of ‘what really motivates people,’ or more correctly a lack of understanding of people who are the targets of communication for a topic which is at best unromantic, quotidian, ordinary, and perhaps even potential negative because it could lead to jury duty. How interesting, however, the study becomes when we peel back the layers, understand the minds of people through segmentation, and through understanding of synergies where two messages combine to do far more than one expected. This type of information, collected across different types of studies, in an iterative process, builds a bank of knowledge for messaging about the common weal, the common good. Having a process such as Mind Genomics embedded in our societal life and in our political process offers far greater benefits to society than we can imagine today. Just imagine messaging for the social good, and doing it expeditiously, inexpensively, effectively.
Technical Appendix Relation between Coefficients Estimated with vs. without the Additive Constant
Mind Genomics is founded on the use of experimental design and OLS (ordinary least-squares) regression. Experimental design creates the test stimuli (vignettes) by specifying the specific combinations. OLS regression deconstructs the response to the vignettes, to estimate the part-worth contribution of each element to the respondent. Traditional Mind Genomics has worked with OLS regressions estimated with an additive constant. The constant is a measure of the likelihood of the response in the absence of the stimulus, a purely theoretical parameter. In this study, comprising six questions, each with six answers or elements, the experimental design called for 48 vignettes. Each element appeared 5x in the 48 vignettes and was absent 43 times. We can estimate two equations for the Total Panel, or indeed two equations for any subgroup, both equations using the same data.
Equation 1: Equation with the additive constant
Binary Dependent Variable (e.g., TOP2) = k0 +k1(A1) + k2(A2) … k36(F6)
Equation 2…which looks exactly like equation 1, but has no additive constant
When we estimate the coefficients, and plot one set against the other in a scatterplot, Figure 2 tells us that the patterns are the same, although the coefficients are higher when there is no additive constant. Figure2 shows an almost perfect co-variation of coefficients estimated in the two ways (R=0.94), with different values, however for the same element.
Acknowledgments
The authors wish to acknowledge the contributions of those students at Pace University, New York, who designed, executed, and wrote up the study for presentation to the Office of the Mayor of New York City. The strategy and messaging were used prior to the elections to encourage New Yorkers to register to vote in the upcoming election. The students then presented the study to professional direct marketers, at a direct marketing conference. In their own words ‘this is a great, practical tool which taught us a lot as we used it and got to see what we could accomplish.’
References
- Harder J, Krosnick JA (2008) Why do people vote? A psychological analysis of the causes of voter turnout. Journal of Social Issues 64: 525-549.
- Gershtenson J, Plane DL, Scacco, J.M. & Thomas, J., (2013) Registering to vote is easy, right? Active learning and attitudes about voter registration. Journal of Political Science Education 9: 379-402.
- Jennings W, Wiezien C (2018) Election polling errors across time and space. Nature Human Behaviour 2: 276-283.
- Rubado ME, Jennings JT (2020) Political consequences of the endangered local watchdog: newspaper decline and mayoral elections in the United States. Urban Affairs Review 56: 1327-1356.
- Kaufman RR, Haggard S (2019) Democratic decline in the United States: What can we learn from middle-income backsliding? Perspectives on Politics 17: 417-432.
- Dale A, Strauss A (2009) Don’t forget to vote: Text message reminders as a mobilization tool. American Journal of Political Science 53: 787-804.
- Knack S (1993) The voter participation effects of selecting jurors from registration lists. The Journal of Law and Economics 36: 99-114.
- Xu AJ, Wyer Jr RS (2012) The role of bolstering and counterarguing mind-sets in persuasion. Journal of Consumer Research 38: 920-932.
- Krantz DH (1964) Conjoint measurement: The Luce-Tukey axiomatization and some extensions. Journal of Mathematical Psychology 1: 248-277.
- Green PE, Krieger AM, Wind Y (2001) Thirty years of conjoint analysis: Reflections and prospects. Interfaces 31: S56-S73.
- Moskowitz HR, Gofman A (2007) Selling blue elephants: How to make great products that people want before they even know they want them. Pearson Education.
- Miller GA, Galanter EH, Pribram KH (2017) (Orig. 1960). Plans and the Structure of Behavior, Routledge.
- Moskowitz HR (2012) ‘Mind Genomics’: The experimental, inductive science of the ordinary, and its application to aspects of food and feeding. Physiology & Behavior 107: 606-613.
- Moskowitz HR, Gofman A, Beckley J, Ashman H (2006) Founding a new science: Mind Genomics. Journal of Sensory Studies 21: 266-307.
- Gofman A, Moskowitz H (2010) Isomorphic permuted experimental designs and their application in conjoint analysis. Journal of Sensory Studies 25: 127-145.
- Xu R, Wunsch D (2008) Clustering (Vol. 10). John Wiley & Sons.