DOI: 10.31038/MGJ.2021422
Abstract
Light can promote the growth and development of wheat seedling during vernalization. However, the mechanism has not been sufficiently explored. In this study, transcriptomic analysis was performed on wheat etiolated seedlings and green seedlings vernalized in dark and light, respectively. Results showed that light could promote photo morphogenesis and photosynthesis of wheat seedlings and increase fresh weigh of seedlings, including root biomass and leaf area. The number of differentially expressed genes (DEGs) between etiolated and green seedlings increased with vernalization time increasing, and the maximum value occurred on vernalization 40 d. GO and KEGG enrichment analysis showed that the main DEGs on vernalization 40 d were significantly different from those on 10, 20 and 30 d in functions. Top GO and KEGG enrichment related to photosynthesis, such as chloroplast, thylakoid, photosynthesis and oxidoreductase activities, were identified on vernalization 40 d. Then a series of candidate genes were identified, 15 of which were confirmed by qRT-PCR. The above findings provide valuable information for understanding the molecular mechanism of light on wheat seedlings during vernalization.
Keywords
Winter wheat, Vernalization, Seedlings, Light, Photosynthesis
Introduction
Wheat (Triticum aestivum L.) is one of the most widely cultivated crops in the world. Its growth and development are determined by complex genetic and environmental factors, in which genes related to vernalization and photoperiod sensitivity play more important roles [1,2].
Winter wheat is sensitive to vernalization and requires a period of continuous cold temperature for its transition from vegetative to reproductive growth [3]. The vernalization response is also integrated with the environmental cue of light. VRN3 is an integrator of the vernalization and photoperiod pathways in temperate cereals, the role of which has been well documented [1,4]. Plants have a sophisticated network to decipher the information of light-temperature integration. The sensation can be defined as a process in which a sensory receptor changes its activity as a result of a stimulus. The photoreceptors phyB and phot have been identified as temperature sensors [5-7].
Light is one of the major environmental factors that regulate seedling growth and development. After seed germination under the soil, dark-grown seedlings usually grow heterotrophically from seed reserves and accumulate protochlorophyllide (Pchlide) via a process referred to as skotomorphogenesis (etiolation; [8]. Upon exposure to light, Pchlide is rapidly converted into chlorophyll to initiate photoautotrophic growth, resulting in large-scale genes expression of photomorphogenesis (greening) [9]. Photomorphogenesis is marked by chlorophyll biosynthesis, differentiation of protoplastids into chloroplasts, initiation of carbon assimilation, elongation and thickening of hypocotyl, and the activation of shoot apical meristem leading to the development [10,11]. There is a comprehensive regulatory network that corresponds to specific morphological aspects in seedling skotomorphogenesis and photomorphogenesis [12-14].
The vernalization in light can promote winter and semi-winter wheat varieties flowering earlier than in dark for [15-17], when plants are stimulated by two external signals, light and low temperature. Some vernalization-responsive genes or proteins have been identified during wheat vernalization by high-throughput transcriptomics and proteomics [18,19]. However, the extent to which genes contribute to wheat seedling development during vernalization remains unclear.
In this study, we conducted RNA-seq analysis to determine the effect of light on transcriptomic changes of wheat seedlings during vernalization. Further, the hypothetical molecular mechanisms of several genes responding to vernalization of wheat in light were discussed.
Materials and Methods
Plant Materials and Vernalization
The uniform seeds of winter wheat Liangxing 99 (vrn-A1/vrn-B1/vrn-D1) were selected and cultivated on plates supplied with moist vermiculite at 25°C in dark, 30 seeds per plate. After 3 d, the developed seedlings were vernalized in dark or in continuous light (25 µmol m-2 s-1) in a growth cabinet at 6°C. The light was provided by cool white fluorescent lamp. At each timepoint of vernalization 0, 10, 20, 30 and 40 d, the fresh weight of single plant, fresh weight of seedling leaves, fresh weight of roots, and the longest root length were all measured. Three biological replicates were conducted. SPSS19.0 and Sigmaplot 12.0 were performed to analyze the difference between etiolated and green seedlings.
RNA-seq Sample Preparation and Sequencing
At each investigation timepoint, about 500 mg samples of shoots and leaves per treatment were collected from 5-15 seedlings for total RNA isolation (Figure 1a and 1b). When sampling, the collected leaves and shoots were immediately frozen in liquid nitrogen and then stored at -80°C. Total RNA was extracted with TRIzol™ Reagent (ThermoFisher, USA) following manufacturer’s instructions and confirmed using the 2100 Bioanalyzer (Agilent Technologies). mRNA was purified and then constructed into sequencing library using TruSeq RNA Sample Preparation Kit v2 (#RS-122-2001, Illumina, USA) following manufacturer’s recommendations. The obtained libraries were adjusted and pooled at a concentration of 20 nmol. Sequencing was performed with 300-400 bp, paired-end reads on the NextSeq 500 (Illumina). Each treatment had two biological replicates.
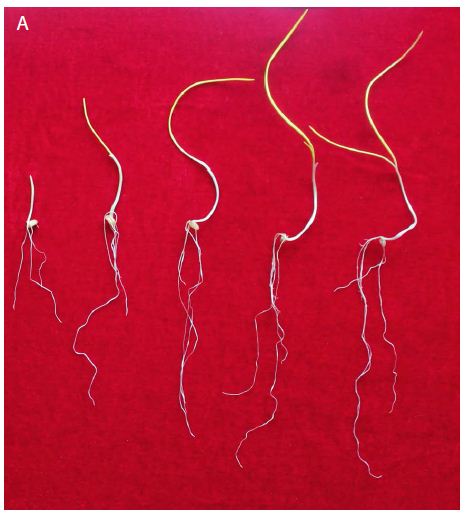
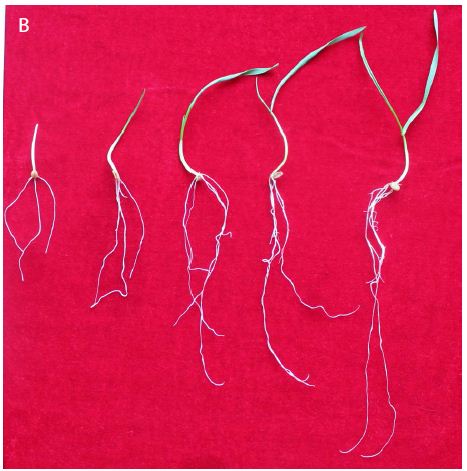
Figure 1: Etiolated and green wheat seedlings used for generating transcriptome, which were vernalized in dark and in light respectively. On each panel, seedlings from left to right were vernalized for 0, 10, 20, 30, and 40 d, respectively.
Data Processing, De-novo Transcriptome Assembly, Differential Expression Gene Analysis
Clean reads with Q-score>20 was further analyzed by removing the adapters and filtering low Q-score reads from raw reads. Reference genome index was constructed using Bowtie2 Software (http://bowtie-bio.sourceforge.net/bowtie2/index.shtml) based on the data in Ensembl (http://www.ensembl.org/). The clean reads were aligned to the reference genome by Tophat2 (http://tophat.cbcb.umd.edu/). The original expression level of corresponding gene was considered to be the alignment value (read count) and was analyzed by HTSeq0.6.1p2 (http://wwwhuber.embl.de/users/anders/HTSeq). The read count was normalized with reads per kilobases per million mapped (RPKM), with >1 as gene expressing threshold. Furthermore, the differential expression genes (DEGs) were analyzed by DESeq with |fold change| >2, P-value <0.05, and false discovery rate (FDR) <0.05.
Functional Analysis on DEGs
Gene ontology (GO, http://geneontology.org/) terms with corrected P-value of less than 0.05 were considered to be significantly enriched. KEGG (Kyoto Encyclopedia of Genes and Genomes, http://www.kegg.jp/) enrichment pathways of DEGs were confirmed with P-value<0.05. The DEGs related to photosynthesis and having a minimum 3-fold change were further analyzed.
Evaluation of RNA-Seq by qRT-PCR
To verify the reliability and accuracy of our transcriptomic data, 15 DEGs associated with photosynthesis, signaling interaction, amino acids metabolism, fatty acid metabolism, etc. were selected and evaluated by qRT-PCR. The primers designed with Primer 5.0 Software (PREMIER Biosoft, USA) are detailed in Table S1. Actin was used as an internal control [20]. Using the identical RNA samples for RNA-seq, qRT-PCR was performed on a C1000 Thermal Cycler (CFX96 Real-Time System, Bio-Rad, USA) using a Quant One Step RT-PCR (SYBR Green) Kit (TianGen, China) following manufacturer’s instructions. Three independent biological replicates and three technical replicates per biological replicate were conducted. The PCR efficiency of target and reference genes were determined by generating standard curves and the relative expression values were calculated using the 2–∆∆CT method [21]. With the expression level value on 0 d set as 1, each DEG expression level was recorded and its significance was analyzed by the independent t-test at P-value <0.05. In addition, the relative expression levels of DEGs were analyzed based on RNA-Seq and qRT-PCR, respectively.
Results
Performance of Wheat Seedlings Vernalized in Dark and in Light Conditions
At the beginning, the seedlings for vernalization treatments were exactly the same. On vernalization 10 d, etiolated seedlings, which was vernalized in dark, showed significantly higher fresh weight (including single plant fresh weight, shoot fresh weight and root fresh weight) and root length than green seedlings (Figure 1). However, with the initiation of the photosynthesis and photomorphogenesis, the fresh weight of green seedlings (vernalized in light) were gradually increased and became more than that of etiolated seedlings from vernalization 20 d (Figure 2A). Although green seedlings had less shoot fresh weight compared with etiolated seedlings on vernalization 40 d (Figure 2B), their root fresh weight and length were both significantly more than etiolated seedlings. This indicated that light promoted the growth of wheat seedlings during vernalization (Figure 2C and 2D).
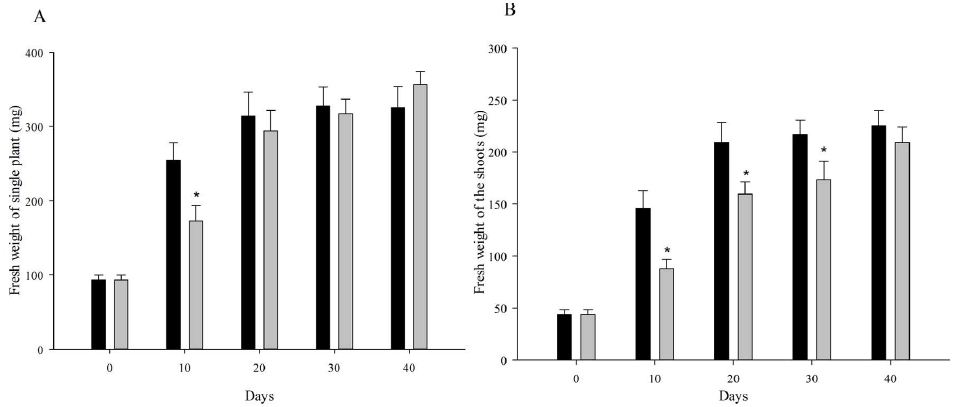
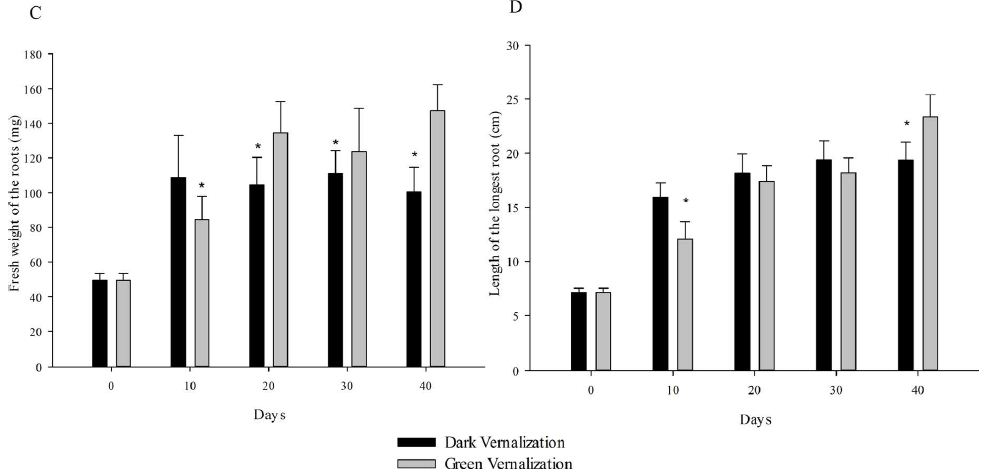
Figure 2: Performance of wheat seedlings development at five timepoints (0, 10, 20, 30, and 40 d) under dark and light vernalization treatments. A: fresh weight of single plant; B: fresh weight of shoots; C: fresh weight of roots; D: length of the longest root. *, data are mean ± SD of three replicates, P-value <0.05.
Identification of Differential Expressed Genes
The expression level of the DEGs was calculated and normalized to FPKM (fragments per kilobase million), and then DEGs between etiolated and green seedlings were screened with fold change >2 and P-value <0.05. The number of DEGs between etiolated and green seedlings on vernalization 0, 10, 20, 30 and 40 d were 0, 6131, 6971, 7249, and 11807, respectively (Table 1). The maximum was on vernalization 40 d, indicating that more metabolic activities had occurred in green seedlings.
Table 1: Primers for quantitative real-time PCR (qRT-PCR).
|
Gene ID |
Forward primer (5’−3′) |
Reverse primer (5’−3′) |
|
TRIAE_CS42_4AL_TGACv1_289136_AA0965610 |
TGCGCGGACAATATATCTCA | GTGCAGGATCAAACACATCG |
| TRIAE_CS42_7BL_TGACv1_579174_AA1904930 | AGTGGTATGCCTGCGAGTGC |
CTGCTGCTTGTTGATGATTGC |
|
TRIAE_CS42_5DL_TGACv1_432937_AA1395210 |
CGATGCCAACAGCGACAA | CGCCATTGATACCCGTCTT |
| TRIAE_CS42_3AL_TGACv1_195180_AA0645990 | GCTACGCACTTTACGGTATCACA |
ACCTTCGCCAACTCCTTCTC |
|
TRIAE_CS42_2DS_TGACv1_179360_AA0606510 |
CATCATTGGAGGGAGAAACCG | CCGCATACTTGGCAAACCTG |
| TRIAE_CS42_3B_TGACv1_237526_AA0832830 | GGAGCTGGTCGAGTTGAAGA |
GAACCAAGCCGCTATCTGGT |
|
TRIAE_CS42_1BS_TGACv1_052086_AA0181320 |
ACCTGGTGTTGCCGATAGAAT | CGTTGGGTCGTCAAACTCATAC |
| TRIAE_CS42_2BL_TGACv1_727308_AA2170970 | ACTATCACCCATCGCATCACA |
ACACGCCTTCCATTCTCCC |
|
TRIAE_CS42_3AL_TGACv1_195180_AA0645980 |
CGGGCCTCGCAATTTACA | AGTCCTCGCCAACTCGGTCT |
| TRIAE_CS42_5DL_TGACv1_433817_AA1422930 | ACCGCCAAACAAACCCAA |
GCAGTCACGAAACCCACCAT |
|
TRIAE_CS42_6AS_TGACv1_486935_AA1566680 |
ACAGCACCAACTACTGCATCC | GGAAGAAGACGACCATCTCCA |
| TRIAE_CS42_6BS_TGACv1_514208_AA1656980 | TCGAGGGGTACTGCATTGTC |
CTTGATCTCCTTCACCTTGAGC |
|
TRIAE_CS42_7BS_TGACv1_594457_AA1957650 |
TACCGACTTCTGCTTCCACTCA | ACCCCAGTAATCATCAATACATCC |
| TRIAE_CS42_5DL_TGACv1_433244_AA1406760 | GTTCTACACGCCGGACAAGA |
GGTAGCGGTGGATAGGGTTT |
|
TRIAE_CS42_6BL_TGACv1_505061_AA1629060 |
CGGACTGGTTCAGGAAGGAC | CACGTGATGTGAGGGTAGGC |
| Actin | GAAGCTGCAGGTATCCATGAGACC |
AGGCAGTGATCTCCTTGCTCATC |
Evaluation of RNA-Seq Data by qRT-PCR
To verify the RNA-seq results, 15 DEGs on vernalization 40 d were further analyzed by qRT-PCR. The expression level of every DEG in etiolated seedlings was set as 1. Then their expression level in green seedlings were recorded. qRT-PCR and t-test analysis showed that each of the 15 DEGs showed significantly different expression levels between etiolated and green seedlings, which was consistent with the result from transcriptome sequencing. Also, their expression patterns correlated well (R2 =0.8123) with those obtained from RNA-seq analysis (Figure 3). Therefore, the transcriptome changes obtained by RNA-seq were accurate.
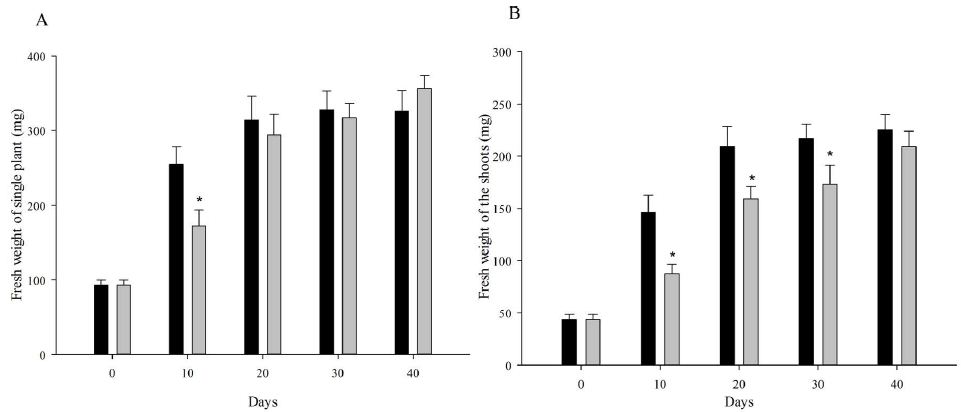
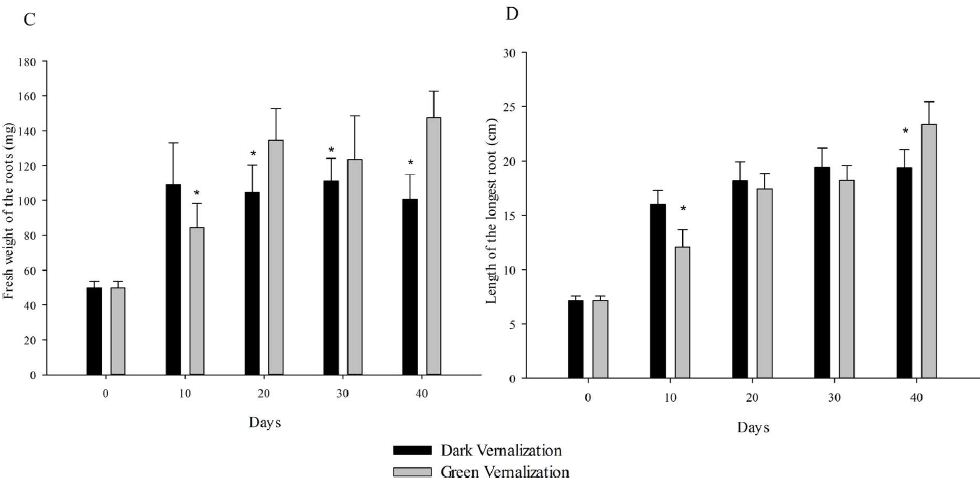
Figure 3: Correlation analysis of the 15 differentially expressed genes (DEGs)’ expression levels revealed by RNA-seq and qRT-PCR, respectively. The plots indicate the log2 (Fold change) in RNA-seq and qRT-PCR.
GO Enrichment Analysis of DEGs
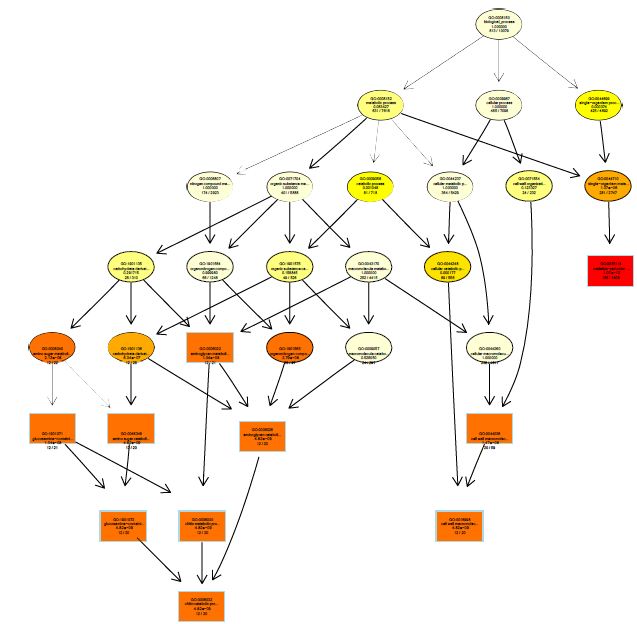
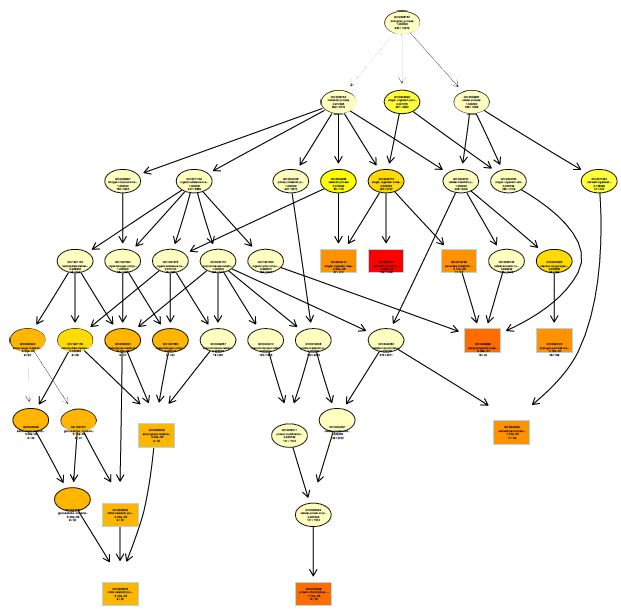
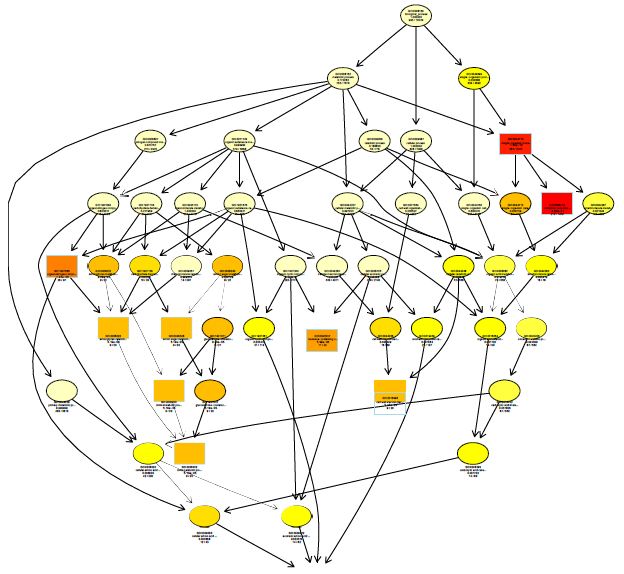
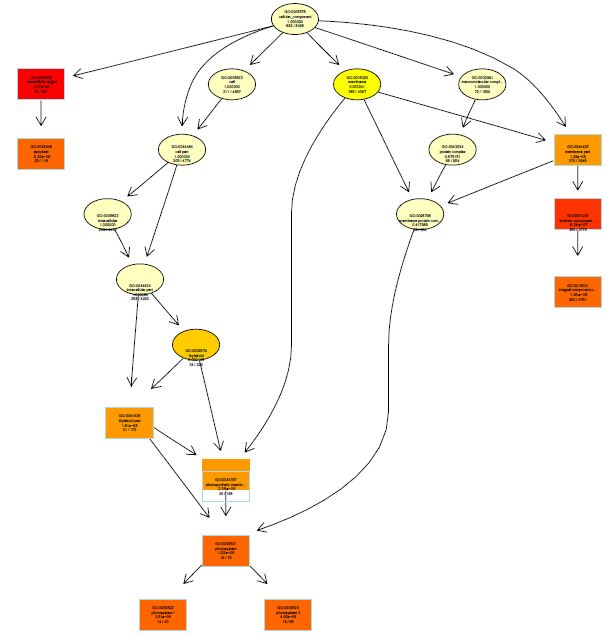
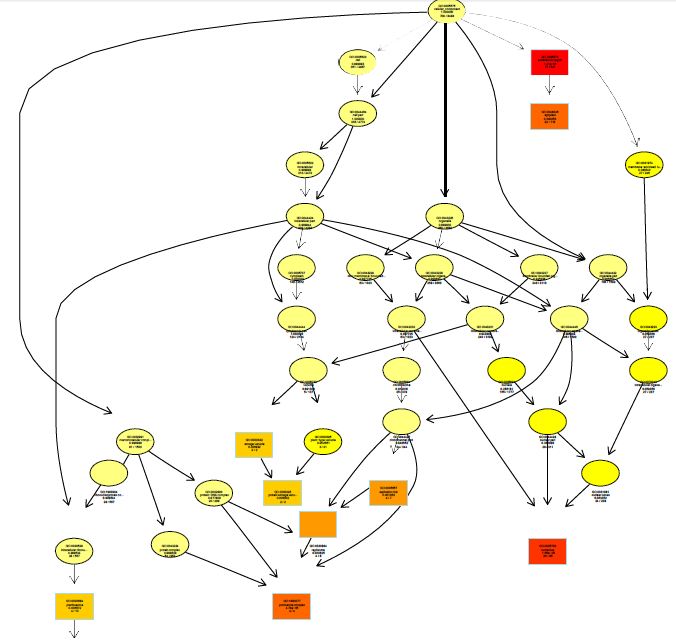
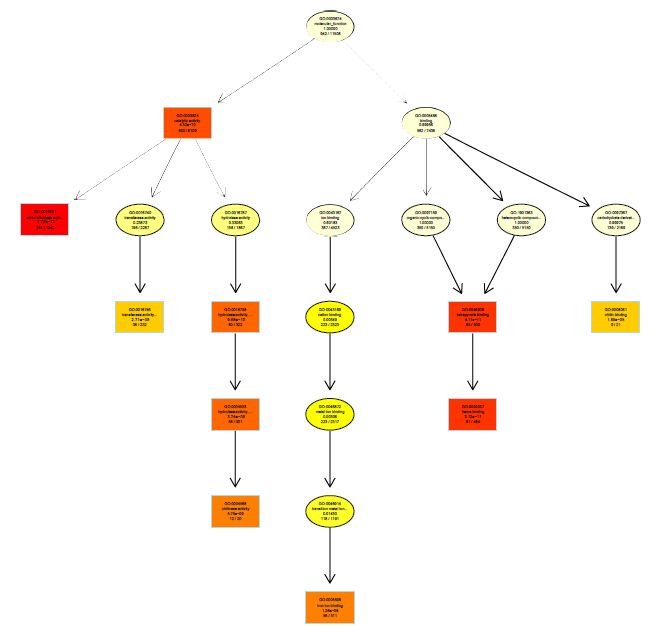
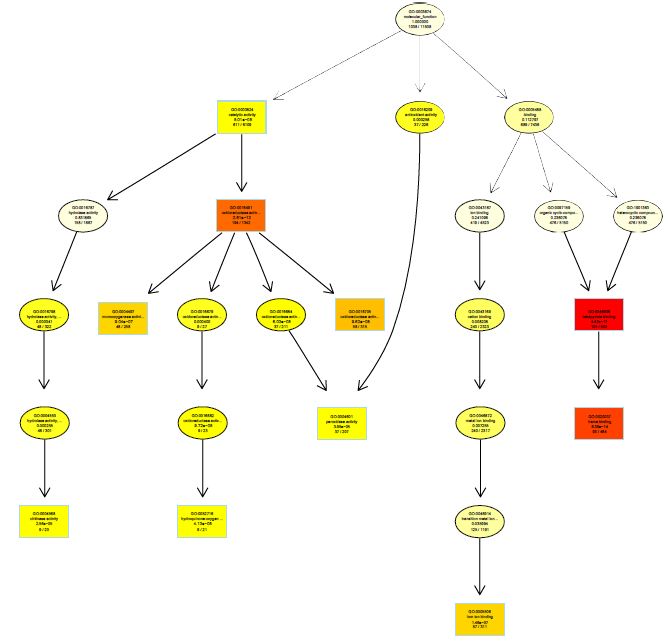
The functions of DEGs were annotated by GO enrichment analysis (P-value <0.05) and then they were divided into three terms: biological process, cellular component and molecular function. The topGO enrichment results for DEGs on 10, 20 and 30 d were almost the same. The biological processes of DEGs were mainly involved in cell wall macromolecule catabolic process, aminoglycan catabolic process, chitin catabolic process and oxidation-reduction process (Figures S1-S3); the cellular components were mainly extracellular region, cytoplasmic region, endoplasmic reticulum, photosystem and membrane part (Figures S4-S6); the molecular functions were mainly involved in oxidoreductase activity, chitinase activity, catalytic activity, heme binding, iron ion binding and tetrapyrrole binding (Figures S7-S9).
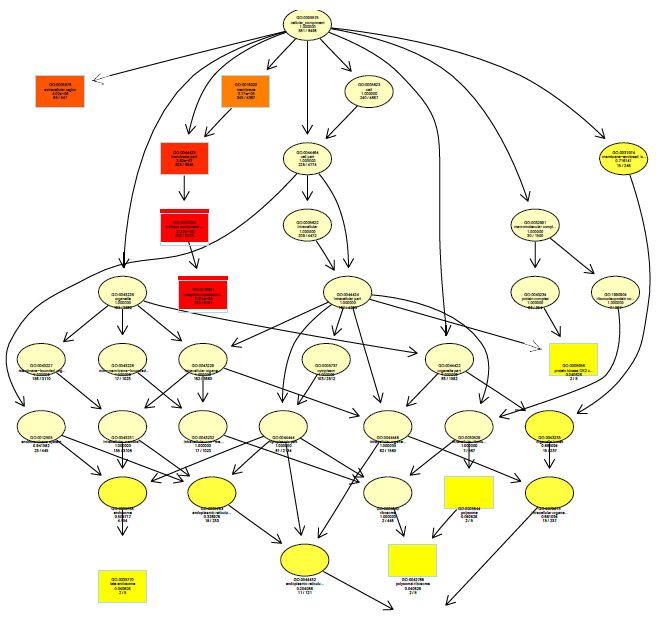
On vernalization 40 d, a total of 2180 DEGs between etiolated and green wheat seedlings were annotated by GO enrichment analysis (P<0.05). The biological process was mainly involved in photosynthesis, chloroplast organization, cellular ketone biosynthesis process (Figure S10), the cell components were associated with chloroplast, plastid, thylakoid (Figure S11), and the molecular function was associated with chlorophyll binding, fructose-bisphosphatase activity, catalytic activity (Figure S12). This result indicated that the DEGs between etiolated and green seedlings on vernalization 40 d were mainly related to photosynthesis.
KEGG Pathway Analysis of DEGs
KEGG enrichment pathways were selected by DESeq with |fold change| > 2, P-value <0.05, and false discovery rate (FDR) <0.05. The top KEGG pathway of DEGs on vernalization 10, 20 and 30 d were nearly the same. They were involved in amino acids metabolism, fatty acid metabolism, metabolism of cytochrome P450, photosynthesis, environmental adaptation, etc. (Figure 4a-4c). While on vernalization 40 d, the top KEGG enrichment pathways were mainly involved in photosynthesis (photosynthesis-antenna proteins, porphyrin and chlorophyll metabolism, photosynthesis, photosynthetic biological nitrogen fixation, carbon fixation in photosynthetic organisms, etc.), secondary metabolism(including synthesis of flavonoid, anthocyanin, ubiquinone and terpenoid-quinone biosynthesis, indole alkaloid, phenylpropanoid, riboflavin, etc.), nitrogen and carbon metabolism (including vitamins, amino acids, carbon, methane, glyoxylate and dicarboxylate, etc.) and environmental adaptation (circadian rhythm, longevity regulating pathway, and estrogen signal transduction, etc.) (Figure 4d).
DEGs Related to Photosynthesis during Wheat Vernalization
To further understand the effect of light on photosynthesis during vernalization, we focused on the DEGs with a minimum three-fold change in expression between etiolated and green seedlings at V40 d according to KEGG enrichment analysis. Compared with etiolated seedlings, the up-regulated genes in green seedlings were related to chloroplast component, nitrogen and carbon synthesis, while the down-regulated genes were related to catalase, dehydrogenase, ubiquitin, phosphate dikinase and glutamine synthetase.
Discussion
The effect of light on the morphological development of seedlings is achieved through regulating the expression levels of a series of genes [22]. In this study, we used whole-transcriptome sequencing to analyze the seedlings vernalized in dark and in light conditions to identify their molecular changes at different times of vernalization. The results showed that light can regulate a series of genes related to skotomorphogenesis and photomorphogenesis, which is consistent with previous studies [11,12,22,23].
Usually, either triggering photosynthesis or initiating flowering is the acting mode of light on plants. The former is the energy source of plant, while the latter is the developmental key from vegetative growth to reproductive development [24,25]. Interestingly, the results in this paper indicated that light can significantly increase the length and fresh weight of roots but inhibit the growth of above ground part of seedlings. Previously, it has been proved that light influence root development and plasticity through complex signaling pathways [26]. Generally, the roots of dark-grown seedlings are much shorter and have a much thinner diameter than those of light-grown seedlings [27,28]. In speed breeding, green plant vernalization can promote winter wheat flowering earlier in the subsequent development process [16,17]. Therefore, during vernalization process, supplementation of light may be conducive to promoting the morphological development of roots and leaves, as well as indirectly promoting later flowering development.
In our study, GO and KEGG enrichment analysis shows that the significantly DEGs between seedlings vernalized in dark and in light are mainly involved in photosynthesis with the elongation of wheat vernalization. Chlorophyll is essential for harvesting light energy during photosynthesis. It is proved that the complex integration of intracellular chloroplast retrograde redox signaling combined with intercellular, and vascular-mediated signaling pathways during vernalization process enhance both photosynthetic capacity and plant biomass production in cold-grown winter cereals.
In this experiment, the level of chloroplast, photosystem II 10 kDa polypeptide, fructose 1,6-bisphosphatase, pyruvate, phosphate dikinase (PPDK) was higher in green seedlings than in etiolated seedlings. Chlorophyll is essential for light harvesting and energy transduction during photosynthesis. Leaf color results from the processes of chlorophylls accumulation in leaf, which is related to chloroplast development and division, biosynthesis [29]. Photosystem II (PSII) is a multisubunit protein-pigment complex embedded in the thylakoid membrane that harnesses light energy to split water into oxygen, protons, and electrons [30]. Fructose 1,6-bisphosphatase is required for optimum regulation of photosynthetic carbon metabolism. Fructose 6-phosphate (F6P) is the branch point for metabolites leaving the Calvin cycle and moving into starch biosynthesis through the conversion into glucose 6-phosphate (G6P) [31]. Pyruvate, phosphate dikinase (PPDK), a key role in the C4 photosynthetic pathway, proposed first functionally seated in C3 plants as an ancillary glycolytic enzyme [32]. In intact spinach chloroplasts, light-induced dephosphorylation of C(3) PPDK was shown to be dependent on photosystem II activity but independent of electron transfer from photosystem I [33-35].
Therefore, the above up-regulation genes associated with photosynthesis and Calvin cycle improves the biomass of seedlings under light. Meanwhile, the developing seedlings under dark could reduce their light-harvesting capacity and components of photosynthetic apparatus.
Conclusions
The analysis of DEGs between seedlings vernalized in dark and in light indicates that light influences plant growth and development by triggering photosynthesis and feeding plants energy. Thus, the supplementation of light during wheat vernalization can directly improve the biomass of seedlings, as well as indirectly promote the later reproductive development.
References
- Distelfeld A, Li C, Dubcovsky J (2009) Regulation of flowering in temperate cereals. Current Opinion in Plant Biology 12: 178-184. [crossref]
- Dennis E S, Peacock W J (2009) Vernalization in cereals. Journal of Biology 8: 57.
- Trevaskis B (2010) The central role of the VERNALIZATION1 gene in the vernalization response of cereals. Function Plant Biology 37: 479-487.
- Yan L, Fu D, Li C, Blechl A, Tranquilli G, et al. (2006) The wheat and barley vernalization gene VRN3 is an orthologue of FT. PNAS 103: 19581-19586. [crossref]
- Jung JH, Domijan M, Klose C, Biswas S, Ezer D, et al. (2016) Phytochromes function as thermosensors in Arabidopsis. Science 354: 886-889. [crossref]
- Legris M, Klose C, Burgie ES, Costigliolo RC, Neme M, et al. (2016) Phytochrome B integrates light and temperature signals in Arabidopsis. Science 354: 897-900. [crossref]
- Fujii Y, Tanaka H, Konno N, Ogasawara Y, Hamashima N, et al. (2017) Phytotropin perceives temperature based on the lifetime of its photoactivated state. Proceedings of the National Academy Sciences of the United States of America 114: 9206-9211.
- Von Arnim A, Deng XW (1996) Light control of seedling development. Ann Rev Plant Physiol Plant Mol Biol 47: 215-243. [crossref]
- Shi H, Lyu MH, Luo YW, Liu SC, Li Y, et al. (2018) Genome-wide regulation of light-controlled seedling morphogenesis by three families of transcription factors. PNAS 115: 6482-6487. [crossref]
- Seo HS, Yang JY, Ishikawa M, Bolle C, Ballesteros ML, et al. (2003) LAF1 ubiquitination by COP1 controls photomorphogenesis and is stimulated by SPA1. Nature 423: 995-999.
- Fox SE, Geniza M, Hanumappa M, Naithani S, Sullivan C, et al. (2014) Denovo transcriptome assembly and analyses of gene expression during photomorphogenesis in diploid wheat Triticum monococcum. PLoS One 9: 96855. [crossref]
- Xiong B, Ye S, Qiu X, Liao L, Sun GC, et al. (2017) Transcriptome analyses of two citrus cultivars (Shiranuhi and Huangguogan) in seedling etiolation. Scientific Reports 7: 46245.
- Xie F, Yuan JL, Li YX, Wang CJ, Tang HY, et al. (2018) Transcriptome analysis reveals candidate genes associated with leaf etiolation of a cytoplasmic male sterility line in Chinese cabbage (Brassica Rapa L. ssp. Pekinensis). Int J Mol Sci 19: 922. [crossref]
- Armarego-Marriott T, Sandoval-Ibañez O, Kowalewska Ł (2020) Beyond the darkness: recent lessons from etiolation and de-etiolation studies. J Exp Bot 71: 1215-1225.
- Mukade K, Kamio M, Hosoda K (1975) Development of new procedures for accelerating generation advancement in breeding rust resistant wheat. Bulletin of the Tohoku National Agricultural Experiment Station 1: 1-5.
- Lu WZ, Zhou YK, Zou ML, Feng XT (1982) A preliminary study on the green-vernalization in wheat. Scientia Agricultura Sinica 2: 20-23.
- Wang HB, Xie XL, Sun GZ, Zhang YQ, Zhao H, et al. (2000) Fast breeding technique to achieve many generations a year in plants. Patent CN 1262031A, Hebei, China.
- Greenup AG, Sasani S, Oliver SN, Walford SA, Millar AA, et al. (2011) Transcriptome analysis of the vernalization response in barley (Hordeum vulgare) seedlings. PLoS ONE 6: 17900. [crossref]
- Feng YL, Kong BB, Zhang J, Chen XN, Yuan JL, et al. (2018) Proteomic analysis of vernalization responsive proteins in winter wheat Jing841. Protein and Peptide Letters 25: 260-274. [crossref]
- Simonetti E, Veronico P, Melillo MT, Delibes Á, Andrés M F, et al. (2009) Analysis of class III peroxidase genes expressed in roots of resistant and susceptible wheat lines infected by Heteroderaavenae. Molecular Plant-Microbe Interactions 22: 1081-1092. [crossref]
- Livak KJ, Schmittgen TD (2001) Analysis of relative gene expression data using real-time quantitative PCR and the 2−ΔΔCT method. Methods 25: 402-408. [crossref]
- Montgomery BL (2016) Spatiotemporal phytochrome signaling during photomorphogenesis: from physiology to molecular mechanisms and back. Frontiers in Plant Science 7: 480. [crossref]
- Kami C, Lorrain S, Hornitschek P, Fankhauser C (2010) Light-regulated plant growth and development. Current Topics in Development Biology 91: 29-66. [crossref]
- Cerdan PD, Chory J (2003) Regulation of flowering time by light quality. Nature 423: 881-885. [crossref]
- Renger T, Müh F (2013) Understanding photosynthetic light-harvesting: A bottom up theoretical approach. Physical Chemistry Chemical Physics 15: 3348-3371.
- Gelderen K V, Kang C, Pierik R (2018) Light signaling, root development and plasticity. Plant Physiology 176: 1049-1060. [crossref]
- Laxmi A, Pan JW, Morsy M, Chen RJ (2008) Light plays an essential role in intracellular distribution of auxin efflux carrier PIN2 in Arabidopsis thaliana. PLoS One 3: 1510. [crossref]
- Dyachok J, Zhu L, Liao FQ, He J, Huq E, et al. (2011) SCAR mediates light-induced root elongation in Arabidopsis through photoreceptors and proteasomes. The Plant Cell 23: 3610-3626. [crossref]
- Yang Y, Chen X, Xu B, Li Y, Ma Y, et al. (2015) Phenotype and transcriptome analysis reveal chloroplast development and pigment biosynthesis together influenced the leaf color formation in mutants of Anthurium andraeanum ‘Sonate’. Front Plant Sci 6: 139. [crossref]
- Crepin A, Santabarbara S, Caffarri S (2016) Biochemical and spectroscopic characterization of highly stable photosystem II supercomplexes from arabidopsis. J Biol Chem 291: 19157-19171. [crossref]
- Tamoi M, Nagaoka M, Miyagawa Y, Shigeoka S (2006) Contribution of fructose-1,6-bisphosphatase and sedoheptulose-1,7-bisphosphatase to the photosynthetic rate and carbon flow in the Calvin cycle in transgenic plants. Plant & Cell Physiology 47: 380-390. [crossref]
- Chastain CJ, Failing CJ, Manandhar L, Zimmerman MA, Lakner MM, et al. (2011) Functional evolution of C4 pyruvate, orthophosphate dikinase. J Exp Bot 62: 3083-3091.
- Chastain CJ, Fries JP, Vogel JA, Randklev CL, Vossen AP, et al. (2002) Pyruvate, orthophosphate dikinase in leaves and chloroplasts of C (3) plants undergoes light-/dark-induced reversible phosphorylation. Plant Physiol 128: 1368-1378. [crossref]
- Dalal VK, Tripathy BC (2018) Water-stress induced downsizing of light-harvesting antenna complex protects developing rice seedlings from photo-oxidative damage. Sci Rep 8: 5955. [crossref]
- Kohzuma K, Froehlich JE, Davis GA, Temple JA, Minhas D, et al. (2017) The role of light-dark regulation of the chloroplast ATP Synthase. Frontiers in Plant Science 8: 1248. [crossref]